

Fine-scale distribution patterns of Synechococcus ecological diversity in microbial mats of Mushroom Spring, Yellowstone National Park
- PMID: 21890675
- PMCID: PMC3209189
- DOI: 10.1128/AEM.05927-11
Fine-scale distribution patterns of Synechococcus ecological diversity in microbial mats of Mushroom Spring, Yellowstone National Park
Abstract
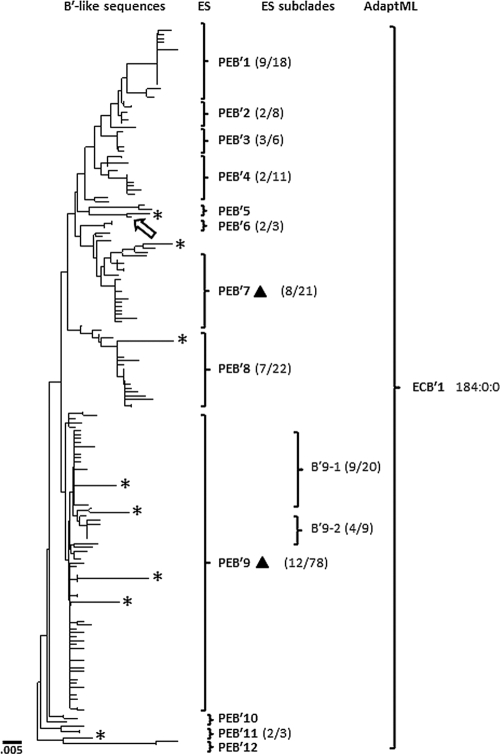
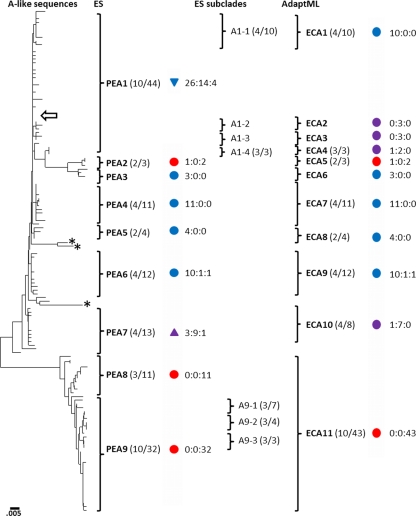
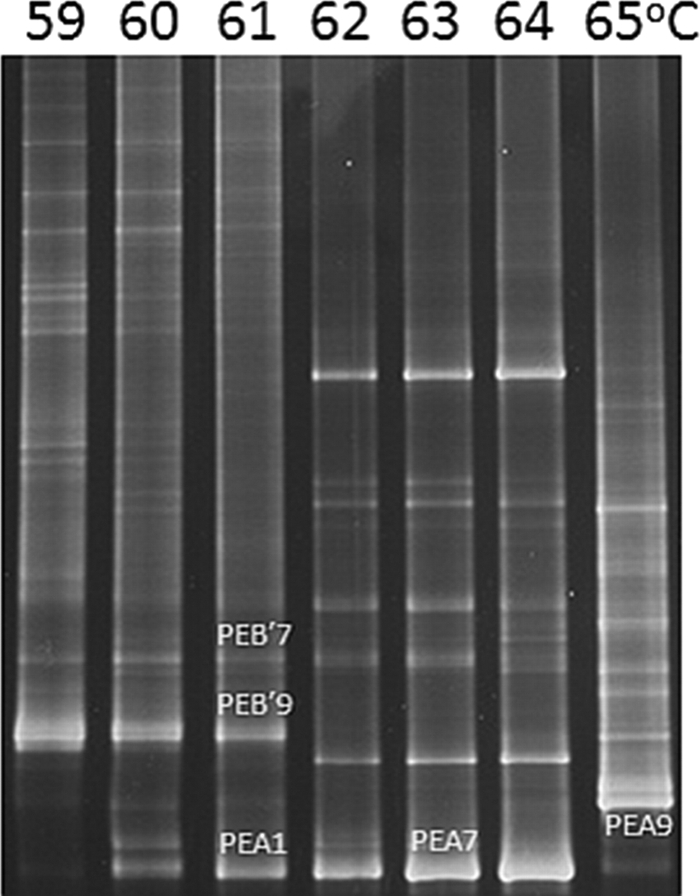
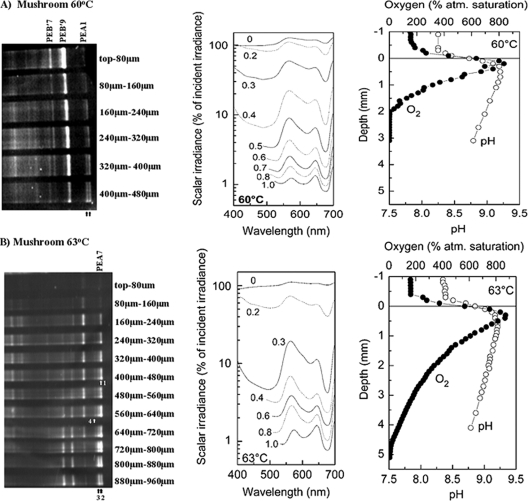
Past analyses of sequence diversity in high-resolution protein-encoding genes have identified putative ecological species of unicellular cyanobacteria in the genus Synechococcus, which are specialized to 60°C but not 65°C in Mushroom Spring microbial mats. Because these studies were limited to only two habitats, we studied the distribution of Synechococcus sequence variants at 1°C intervals along the effluent flow channel and at 80-μm vertical-depth intervals throughout the upper photic layer of the microbial mat. Diversity at the psaA locus, which encodes a photosynthetic reaction center protein (PsaA), was sampled by PCR amplification, cloning, and sequencing methods at 60, 63, and 65°C sites. The evolutionary simulation programs Ecotype Simulation and AdaptML were used to identify putative ecologically distinct populations (ecotypes). Ecotype Simulation predicted a higher number of putative ecotypes in cases where habitat variation was limited, while AdaptML predicted a higher number of ecologically distinct phylogenetic clades in cases where habitat variation was high. Denaturing gradient gel electrophoresis was used to track the distribution of dominant sequence variants of ecotype populations relative to temperature variation and to O₂, pH, and spectral irradiance variation, as measured using microsensors. Different distributions along effluent channel flow and vertical gradients, where temperature, light, and O₂ concentrations are known to vary, confirmed the ecological distinctness of putative ecotypes.
Figures
References
-
- Allewalt J. P., Bateson M. M., Revsbech N. P., Slack K., Ward D. M. 2006. Effect of temperature and light on growth of and photosynthesis by Synechococcus isolates typical of those predominating in Octopus Spring microbial mat community of Yellowstone National Park. Appl. Environ. Microbiol. 72:544–550 - PMC - PubMed
-
- Altschul S. F., Gish W., Miller W., Myers E. W., Lipman D. J. 1990. Basic local alignment search tool. J. Mol. Biol. 215:403–410 - PubMed
-
- Béjà O., Spudich E. N., Spudicn J. L., Leclerc M., DeLong E. F. 2001. Proteorhodopsin phototrophy in the ocean. Nature 411:786–789 - PubMed
-
- Bhaya D., et al. 2007. Population level functional diversity in a microbial community revealed by comparative genomic and metagenomic analysis. ISME J. 1:703–713 - PubMed
Publication types
MeSH terms
Substances
Associated data
- Actions
- Actions
- Actions
- Actions
- Actions
- Actions
- Actions
- Actions
- Actions
- Actions
- Actions
- Actions
- Actions
- Actions
- Actions
- Actions
- Actions
- Actions
- Actions
- Actions
- Actions
- Actions
- Actions
- Actions
- Actions
- Actions
- Actions
- Actions
- Actions
- Actions
- Actions
- Actions
- Actions
- Actions
- Actions
- Actions
- Actions
- Actions
- Actions
- Actions
- Actions
- Actions
- Actions
- Actions
- Actions
- Actions
- Actions
- Actions
- Actions
- Actions
- Actions
- Actions
- Actions
- Actions
- Actions
- Actions
- Actions
- Actions
- Actions
- Actions
- Actions
- Actions
- Actions
- Actions
- Actions
- Actions
- Actions
- Actions
- Actions
- Actions
- Actions
- Actions
- Actions
- Actions
- Actions
- Actions
- Actions
- Actions
- Actions
- Actions
- Actions
- Actions
- Actions
- Actions
- Actions
- Actions
- Actions
- Actions
- Actions
- Actions
- Actions
- Actions
- Actions
- Actions
- Actions
- Actions
- Actions
- Actions
- Actions
- Actions
- Actions
- Actions
- Actions
- Actions
- Actions
- Actions
- Actions
- Actions
- Actions
- Actions
- Actions
- Actions
- Actions
- Actions
- Actions
- Actions
- Actions
- Actions
- Actions
- Actions
- Actions
- Actions
- Actions
- Actions
- Actions
- Actions
- Actions
- Actions
- Actions
- Actions
- Actions
- Actions
- Actions
- Actions
- Actions
- Actions
- Actions
- Actions
- Actions
- Actions
- Actions
- Actions
- Actions
- Actions
- Actions
- Actions
- Actions
- Actions
- Actions
- Actions
- Actions
- Actions
- Actions
- Actions
- Actions
- Actions
- Actions
- Actions
- Actions
- Actions
- Actions
- Actions
- Actions
- Actions
- Actions
- Actions
- Actions
- Actions
- Actions
- Actions
- Actions
- Actions
- Actions
- Actions
- Actions
- Actions
- Actions
- Actions
- Actions
- Actions
- Actions
- Actions
- Actions
- Actions
- Actions
- Actions
- Actions
- Actions
- Actions
- Actions
- Actions
- Actions
- Actions
- Actions
- Actions
- Actions
- Actions
- Actions
- Actions
- Actions
- Actions
- Actions
- Actions
- Actions
- Actions
- Actions
- Actions
- Actions
- Actions
- Actions
- Actions
- Actions
- Actions
- Actions
- Actions
- Actions
- Actions
- Actions
- Actions
- Actions
- Actions
- Actions
- Actions
- Actions
- Actions
- Actions
- Actions
- Actions
- Actions
- Actions
- Actions
- Actions
- Actions
- Actions
- Actions
- Actions
- Actions
- Actions
- Actions
- Actions
- Actions
- Actions
- Actions
- Actions
- Actions
- Actions
- Actions
- Actions
- Actions
- Actions
- Actions
- Actions
- Actions
- Actions
- Actions
- Actions
- Actions
- Actions
- Actions
- Actions
- Actions
- Actions
- Actions
- Actions
- Actions
- Actions
- Actions
- Actions
- Actions
- Actions
- Actions
- Actions
- Actions
- Actions
- Actions
- Actions
- Actions
- Actions
- Actions
- Actions
- Actions
- Actions
- Actions
- Actions
- Actions
- Actions
- Actions
- Actions
- Actions
- Actions
- Actions
- Actions
- Actions
- Actions
- Actions
- Actions
- Actions
- Actions
- Actions
- Actions
- Actions
- Actions
- Actions
- Actions
- Actions
- Actions
- Actions
- Actions
- Actions
- Actions
- Actions
- Actions
- Actions
- Actions
- Actions
- Actions
- Actions
- Actions
- Actions
- Actions
- Actions
- Actions
- Actions
- Actions
- Actions
LinkOut - more resources
Full Text Sources
Miscellaneous
