. 2011 Oct;21(10):1601-15.
doi: 10.1101/gr.116095.110. Epub 2011 Sep 2.

Genome-wide analysis distinguishes hyperglycemia regulated epigenetic signatures of primary vascular cells

Affiliations

Genome-wide analysis distinguishes hyperglycemia regulated epigenetic signatures of primary vascular cells

Luciano Pirola et al. Genome Res. 2011 Oct.

Abstract

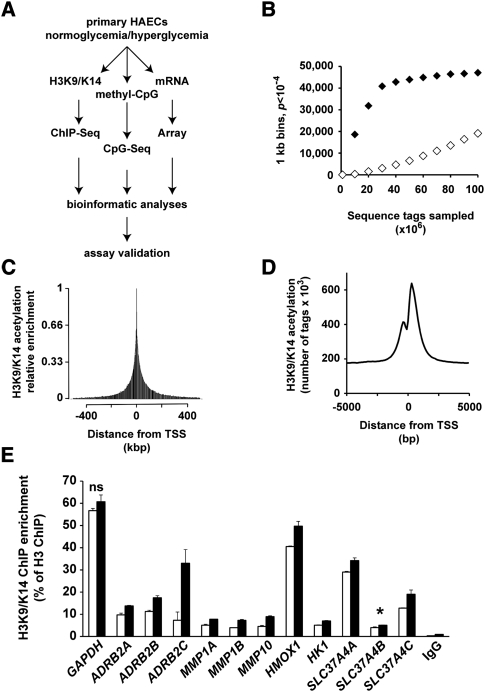
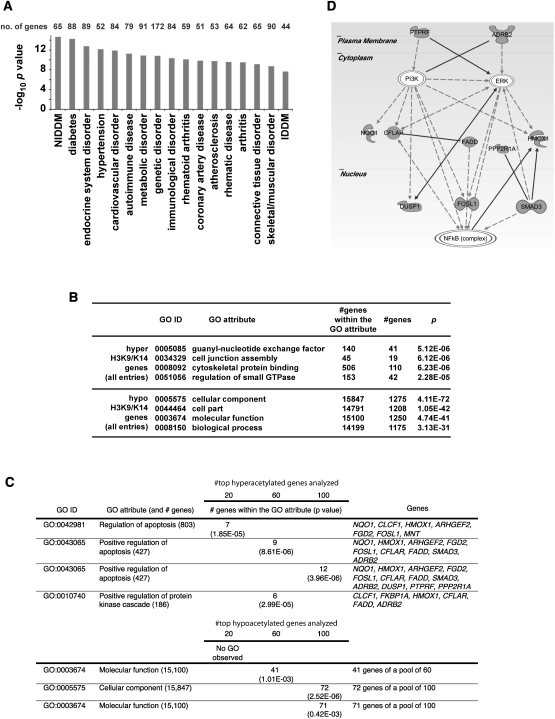
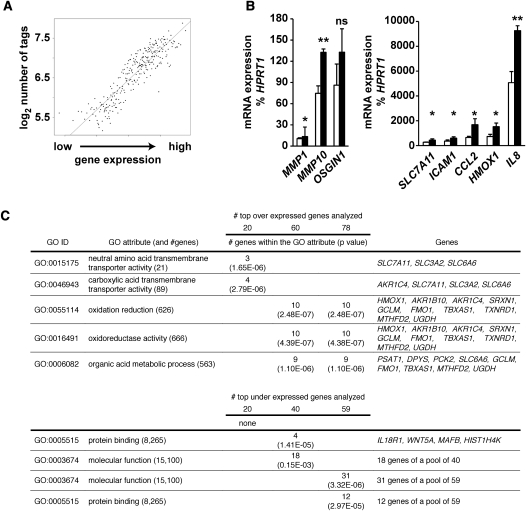
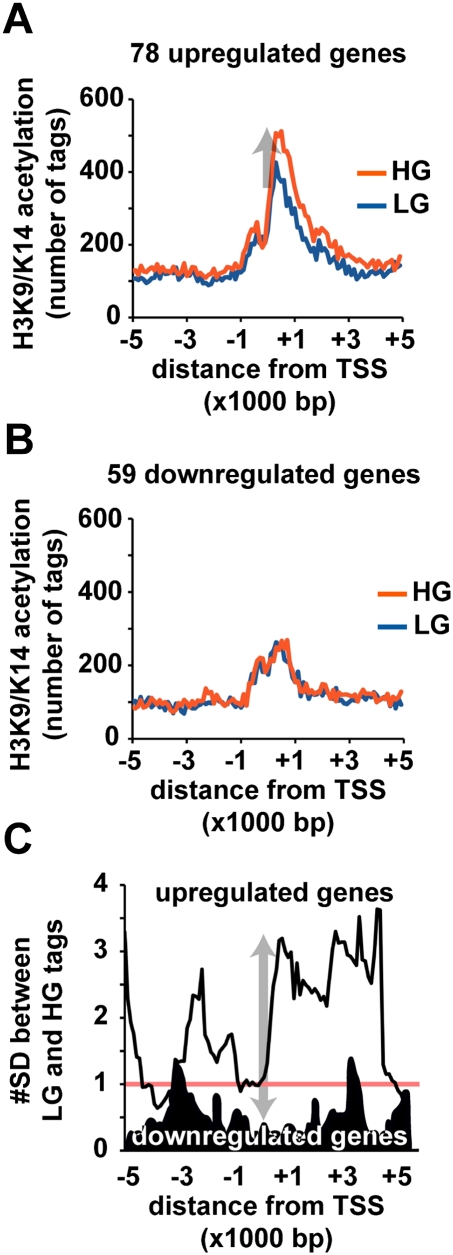
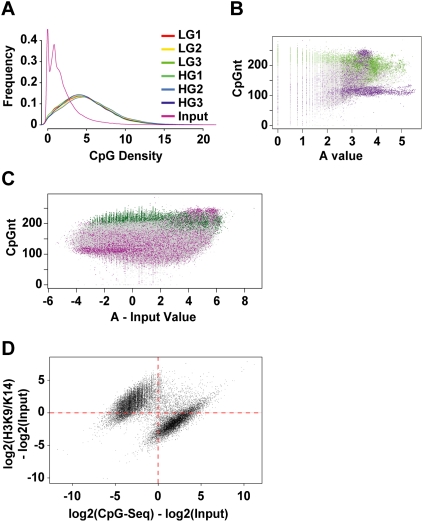
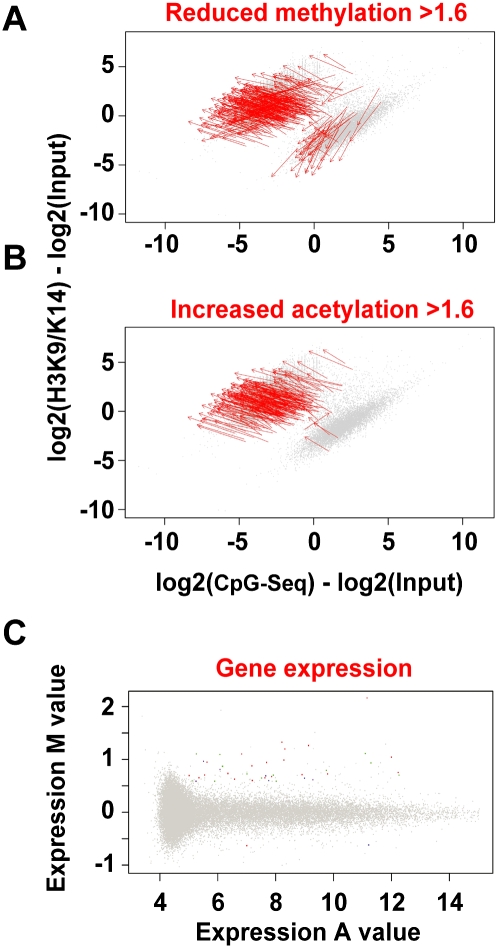
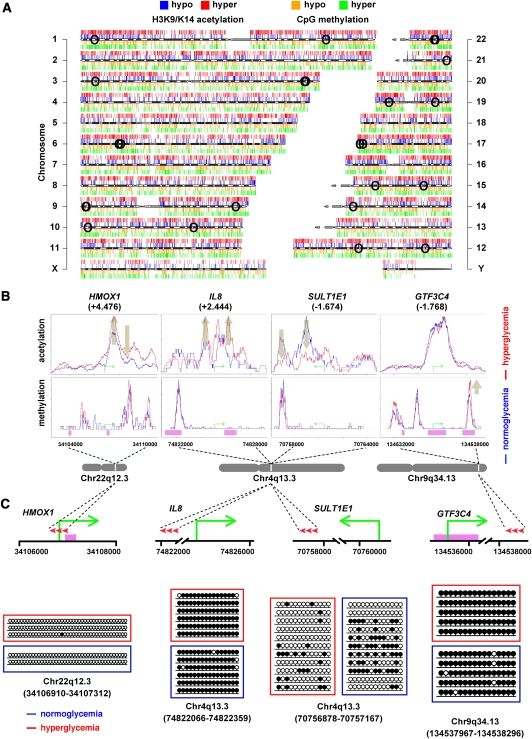
Emerging evidence suggests that poor glycemic control mediates post-translational modifications to the H3 histone tail. We are only beginning to understand the dynamic role of some of the diverse epigenetic changes mediated by hyperglycemia at single loci, yet elevated glucose levels are thought to regulate genome-wide changes, and this still remains poorly understood. In this article we describe genome-wide histone H3K9/K14 hyperacetylation and DNA methylation maps conferred by hyperglycemia in primary human vascular cells. Chromatin immunoprecipitation (ChIP) as well as CpG methylation (CpG) assays, followed by massive parallel sequencing (ChIP-seq and CpG-seq) identified unique hyperacetylation and CpG methylation signatures with proximal and distal patterns of regionalization associative with gene expression. Ingenuity knowledge-based pathway and gene ontology analyses indicate that hyperglycemia significantly affects human vascular chromatin with the transcriptional up-regulation of genes involved in metabolic and cardiovascular disease. We have generated the first installment of a reference collection of hyperglycemia-induced chromatin modifications using robust and reproducible platforms that allow parallel sequencing-by-synthesis of immunopurified content. We uncover that hyperglycemia-mediated induction of genes and pathways associated with endothelial dysfunction occur through modulation of acetylated H3K9/K14 inversely correlated with methyl-CpG content.


Figures

Figure 1.
Figure 1.
Study-power analysis and distribution of sequenced tags around the TSS of genes. (A) General schematic plans of the experiments and analyses performed in this study. (B) ChIP-seq-derived tags from independent experiments were pooled in 1-kb windows. For each 1-kb window, a Poisson test was applied to achieve P-value. (♦) H3K9/K14 acetylation LG ChIP-seq versus input; (◊) H3K9/K14 acetylation LG versus HG ChIP-seq. (C,D) The positions of all sequenced tags, pooled in 2.5-kbp and 100-bp windows, are expressed relative to the nearest genomic TSS determined on the human NCBI genome build 36.1. (C) Visualization of relative enrichment on a 1-Mbp window identifies that H3K9/K14 acetylation decreases exponentially on both sides of the TSS. (D) Visualization of relative enrichment on a 10,000-bp window centered on the TSS. (E) Validation by quantitative PCR of ChIP-seq differential tag enrichments. H3K9/K14 acetylation was monitored in 12 genomic regions from seven genes derived from independent experiments. Enrichments were normalized to H3. Specificity was assessed using IgG antibody. Differences in all analyzed results are statistically significant (P < 0.05, unpaired t-test) excluding GAPDH ([ns] not significant, P = 0.21). SLC37A4 amplicon B ([*] P = 0.057).
Figure 2.
Figure 2.
Distribution of hyperglycemia-induced genes with differentially acetylated regions in primary human vascular cells. (A) Annotations for genes containing H3K9/K14 acetylation conferred by hyperglycemia were performed by Ingenuity System software analysis. Functional annotations are ranked according to their degree of significance with pathological condition. The number of genes contributing to the analysis is reported with 17 of the top 21 hits identified with functional or physiopathological links to hyperglycemic damage. The full list of genes is presented in Supplemental Table 2. (NIDDM) Non-insulin-dependent diabetes mellitus; (IDDM) insulin-dependent diabetes mellitus. (B) Gene ontologies (GOs) have been defined for H3K9/K14 hyperacetylation and hypoacetylation. For each GO association, the number of genes within a GO attribute and the number of observed genes is reported. (C) Hyperglycemia determined GOs have been ranked and defined for 20, 60, and 100 genes associated with genomic regions displaying the most significant increase or decrease in H3K9/K14 acetylation. (D) Representative Ingenuity Pathway Analysis map generated for the subset of hyperacetylated genes conferred by hyperglycemia representing the GO attribute “Positive regulation of apoptosis.”
Figure 3.
Figure 3.
Relationship between mRNA expression and histone acetylation with gene ontologies in primary human vascular cells. (A) Genes were pooled according to expression in groups of 20 and the number of tags from ChIP-seq experiments (−1 to +1 kb TSS) was calculated. (B) Validation by quantitative real-time PCR of mRNA expression changes mediated by hyperglycemia. Values are displayed as % expression of the housekeeping gene HPRT1, which does not change significantly in response to hyperglycemia. Empty bars represent LG-treated HAECs; black bars represent HAECs exposed to HG. (*) P < 0.05, paired t-test; (**) P < 0.01, paired t-test; (ns) not significant. n ≥ 3. Quantitative real-time PCR reactions for each independent replicate were performed in duplicate. (C) Gene ontologies defined for the subset of up-regulated (20, 60, and 78) genes and down-regulated (20, 40, and 59) genes mediated by hyperglycemia.
Figure 4.
Figure 4.
Hyperglycemia confers genome-wide H3K9/K14 acetylation patterns close to the transcription start site of promoters in human vascular cells. (A) Genomic positions of sequenced tags are grouped in 100-bp windows relative to the 78 genes with expression values >1.5-fold. (B) Analysis of 59 down-regulated genes with expression values >1.5-fold. Plots are expressed relative to transcription start sites determined on the human NCBI genome build 36.1. The cumulative number of tags within each 100-bp window is plotted relative to the transcription start site. (Blue line) LG exposed HAECs; (red line) HG exposed HAECs. (C) Sliding window calculation demonstrates significant difference between HG and LG traces relative to the pool of up-regulated genes (light trace) and down-regulated genes (dark trace).
Figure 5.
Figure 5.
Distribution of CpG-seq tags in human vascular cells. (A) Enrichment of CpG sequences determined by comparing methyl-capture against the input. Shown here are three experiments of libraries prepared for CpG-seq derived from vascular endothelial cells exposed to low-glucose (LG) or high-glucose (HG) conditions. (B) Distribution of CpG-seq-enriched DNA with respect to C+G counts in 300-bp bins. Green indicates reads localized to CpG islands and purple indicates reads mapping to repeat sequences. (C) Representation of methylated DNA distributed between CpG islands (green) and repeat sequences (purple). Read counts are normalized for 300 bp and subtracted from the same count of input samples. (D) Relationship between the normalized and input-subtracted values of histone acetylation (y-axis) and CpG methylation (x-axis). The plot shows a mutually exclusive distribution of hyperacetylated and unmethylated regions (upper left) distinguished from methylated CpGs and hypoacetylated sites (lower right). The Fisher-exact probability for this quadrant distribution shown by the red dotted axes is estimated at P = 10−75.
Figure 6.
Figure 6.
Hyperglycemia confers distinguishable gene-activating histone hyperacetylation and DNA methylation changes in the human vascular cell. (A,B) Red arrows represent regions in the genome with changes in values >1.6-fold mediated by hyperglycemia. (A) Decreased CpG-seq counts mediated by hyperglycemia. (B) Increased acetylation ChIP-seq counts conferred by hyperglycemia. Genes were associated with increased CpG methylation (green), decreased methylation (purple), increased acetylation (red), and decreased acetylation (blue). (C) Integration of H3K9/K14 hyperacetylation and CpG methylation associated with gene expression changes.
Figure 7.
Figure 7.
Genome-wide changes conferred by hyperglycemia in the human vascular cell. (A) Human ideogram illustrating the correlation between histone acetylation and the methylome mediated by hyperglycemia. ChIP-seq tracks for hypo- (blue) and hyper- (red) acetylated histone H3K9/K14 are shown above each individual chromosome. CpG-seq tracks for hypo- (orange) and hyper- (green) methylated CpG sequences are shown below each chromosome. (○) Genome localities of individual SNPs associated with diseases listed in Table 5. (B) Mapping specific hyperglycemia-induced histone acetylation and genomic methylation signatures associated with changes in gene expression. H3K9/K14 acetylation and CpG methylation signatures are shown for normoglycemia (blue) and hyperglycemia (red) relative to the transcription start site shown by a green arrow for HMOX1, IL8, SULT1E1, and GTF3C4 genes. Pink regions represent CpG Islands. (C) Experimental validation of CpG-seq tags using bisulfite sequencing of HMOX1 (position chr22:34106910–34107312, region size 403 bp), IL8 (position chr4:74822066–74822359, region size 294), SULT1E1 (position chr4:70756878–70757167, region size 290), and GTF3C4 (position chr9:134537967–134538296, region size 330). (•) Methylated CpG sites; (○) unmethylated CpG sites. Red arrowheads represent the relative positions of bisulfite sequenced amplicons.

References

    1. Araki Y, Wang Z, Zang C, Wood WH 3rd, Schones D, Cui K, Roh TY, Lhotsky B, Wersto RP, Peng W, et al. 2009. Genome-wide analysis of histone methylation reveals chromatin state-based regulation of gene transcription and function of memory CD8+ T cells. Immunity 30: 912–925 - PMC - PubMed
    1. Bell CG, Teschendorff AE, Rakyan VK, Maxwell AP, Beck S, Savage DA 2010. Genome-wide DNA methylation analysis for diabetic nephropathy in type 1 diabetes mellitus. BMC Med Genomics 3: 33 doi: 10.1186/1755-8794-3-33 - PMC - PubMed
    1. Benton RL, Maddie MA, Dincman TA, Hagg T, Whittemore SR 2009. Transcriptional activation of endothelial cells by TGFβ coincides with acute microvascular plasticity following focal spinal cord ischaemia/reperfusion injury. ASN Neuro 1: e00015 doi: 10.1042/AN20090008 - PMC - PubMed
    1. Berger SL, Kouzarides T, Shiekhattar R, Shilatifard A 2009. An operational definition of epigenetics. Genes Dev 23: 781–783 - PMC - PubMed
    1. Bock C, Reither S, Mikeska T, Paulsen M, Walter J, Lengauer T 2005. BiQ Analyzer: visualization and quality control for DNA methylation data from bisulfite sequencing. Bioinformatics 21: 4067–4068 - PubMed

Publication types

MeSH terms

Associated data