. 2011 Dec;124(2):299-310.
doi: 10.1093/toxsci/kfr226. Epub 2011 Sep 2.

Aryl hydrocarbon receptor-mediated induction of Stearoyl-CoA desaturase 1 alters hepatic fatty acid composition in TCDD-elicited steatosis

Affiliations

Aryl hydrocarbon receptor-mediated induction of Stearoyl-CoA desaturase 1 alters hepatic fatty acid composition in TCDD-elicited steatosis

Michelle M Angrish et al. Toxicol Sci. 2011 Dec.

Abstract

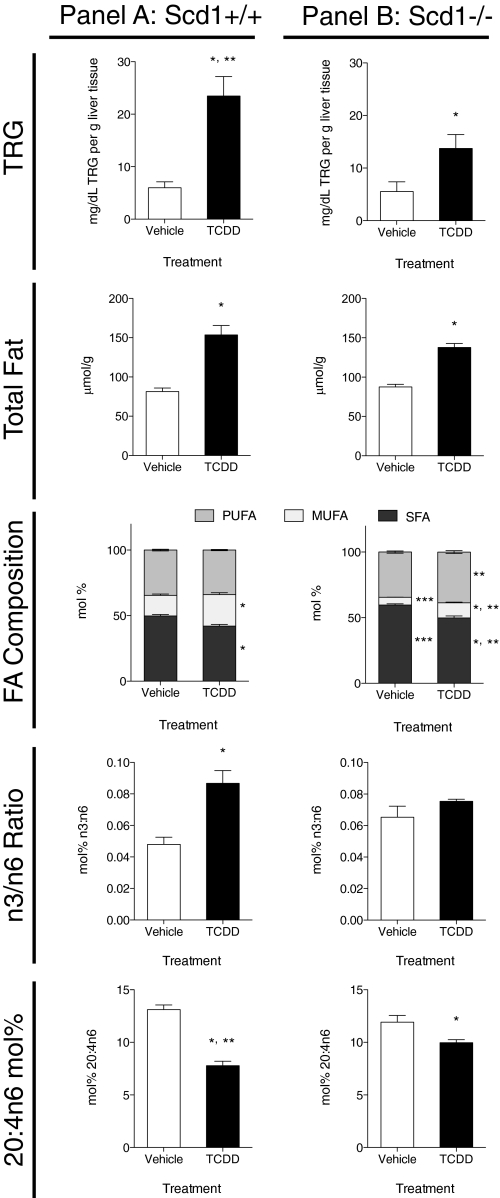
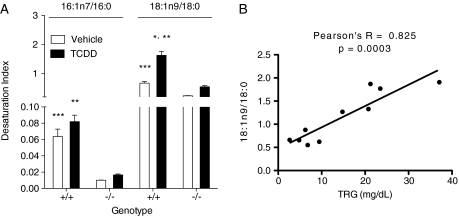
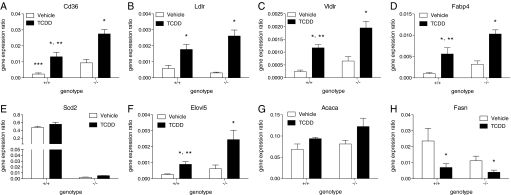
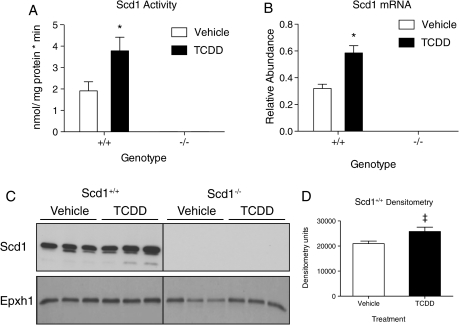
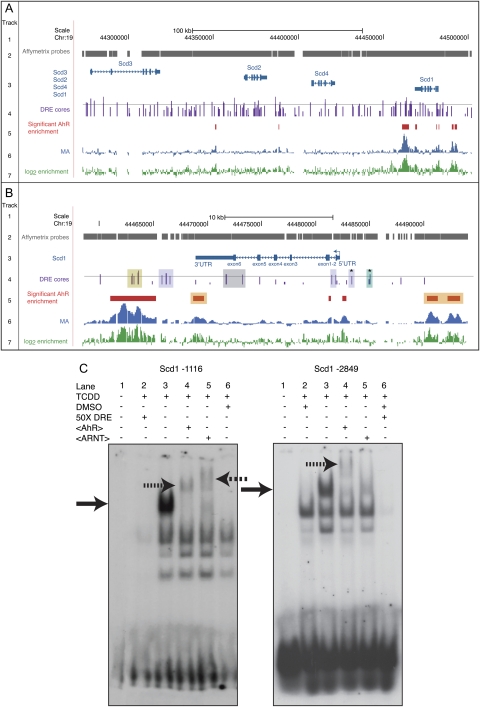
2,3,7,8-tetrachlorodibenzo-ρ-dioxin (TCDD) induces hepatic dyslipidemia mediated by the aryl hydrocarbon receptor (AhR). Stearoyl-CoA desaturase 1 (Scd1) performs the rate-limiting step in monounsaturated fatty acid (MUFA) synthesis, desaturating 16:0 and 18:0 into 16:1n7 and 18:1n9, respectively. To further examine the role of Scd1 in TCDD-induced hepatotoxicity, comparative studies were performed in Scd1(+/+) and Scd1(-/-) mice treated with 30 μg/kg TCDD. TCDD induced Scd1 activity, protein, and messenger RNA (mRNA) levels approximately twofold. In Scd1(+/+) mice, hepatic effects were marked by increased vacuolization and inflammation and a 3.5-fold increase in serum alanine aminotransferase (ALT) levels. Hepatic triglycerides (TRGs) were induced 3.9-fold and lipid profiling by gas chromatography-mass spectroscopy measured a 1.9-fold increase in fatty acid (FA) levels, consistent with the induction of lipid transport genes. Induction of Scd1 altered FA composition by decreasing saturated fatty acid (SFA) molar ratios 8% and increasing MUFA molar ratios 9%. Furthermore, ChIP-chip analysis revealed AhR enrichment (up to 5.7-fold), and computational analysis identified 16 putative functional dioxin response elements (DREs) within Scd1 genomic loci. Band shift assays confirmed AhR binding with select DREs. In Scd1(-/-) mice, TCDD induced minimal hepatic vacuolization and inflammation, while serum ALT levels remained unchanged. Although Scd1 deficiency attenuated TCDD-induced TRG accumulation, overall FA levels remained unchanged compared with Scd1(+/+) mice. In Scd1(-/-) mice, TCDD induced SFA ratios 8%, reduced MUFA ratios 13%, and induced polyunsaturated fatty acid ratios 5% relative to treated Scd1(+/+) mice. Collectively, these results suggest that AhR regulation of Scd1 not only alters lipid composition but also contributes to the hepatotoxicity of TCDD.


Figures

FIG. 1.
FIG. 1.
Hepatic lipid composition at 168 h in vehicle and 30 μg/kg TCDD-treated Scd1+/+ (panel A) and Scd1/ (panel B) mice. Total triglycerides (TRGs) were extracted from mouse liver and quantified using a commercial L-Type Triglyceride M kit (Wako Diagnostics). Data are reported as mg/dL TRG per gram of liver tissue. Absolute total hepatic fat was extracted from Scd1+/+ and Scd1/ mouse liver and analyzed by GC-MS and are reported as μmol/g tissue. Hepatic fat compositions (SFA/MUFA/PUFA ratios) are reported as mol%. SFA (dark gray)/MUFA (light gray)/PUFA (medium gray) proportions are represented. n3/n6 FA ratios are reported as mol %. Arachidonic acid (20:4n6) levels are reported as mol%. Data were analyzed by factorial ANOVA followed by Tukey’s post hoc test. Bars represent mean ± SEM, n = 5 biological replicates. *, p < 0.05 for TCDD compared with vehicle within a genotype; **, p < 0.05 for Scd1/ TCDD compared with Scd1+/+ TCDD; ***, p < 0.05 for Scd1/ vehicle compared with Scd1+/+ vehicle.
FIG. 2.
FIG. 2.
PCA of GC-MS lipid profiles from TCDD (T) or Vehicle (V) treated Scd1+/+, Scd1+/−, and Scd1/ mice 24, 72, and 168 h postdose. PCA was performed in R as described in the “Materials and Methods.” PC1 and PC2 accounted for 95% of the cumulative proportion of the variance with vehicles clustering along PC1, treated groups separating along PC1, and genotype separating along PC2. Dashed lines (Scd1/), dotted lines (Scd1+/-), solid lines (Scd1+/+), n = 5 biological replicates.
FIG. 3.
FIG. 3.
Scd1 activity (desaturation) index (A) in female TCDD (T) or vehicle (V) treated Scd1+/+ and Scd1/ mice. The desaturation index is the ratio of palmitoleic (16:1n7) or oleic acid (18:1n9) to the precursors palmitic (16:0) or stearic acids (18:0), respectively. Bars represent mean ± SEM, n = 5 biological replicates. *, p < 0.05 for TCDD compared with vehicle within a genotype; **, p < 0.05 for Scd1/ TCDD compared with Scd1+/+ TCDD; ***, p < 0.05 for Scd1/ vehicle compared with Scd1+/+ vehicle. Data were analyzed by factorial ANOVA followed by Tukey’s post hoc test. (B) Correlation analysis was performed in Graphpad Prism 5.0a between the hepatic triglyceride (TRG) levels and the 18:1n9/18:0 desaturation index in Scd1+/+ mice gavaged with 30 μg/kg with TCDD or vehicle for 168 h.
FIG. 4.
FIG. 4.
QRTPCR of hepatic lipid transport, modification, and biosynthesis genes in Scd1+/+ (+/+) and Scd1/ (−/−) mice gavaged with 30 μg/kg TCDD or sesame oil vehicle for 24 h. The gene expression ratio is the total quantity normalized to the geometric mean of Hprt, Actb, and Gapdh mRNA levels. Genes are indicated by official gene symbols. Error bars represent the SEM, n = 5. *, p < 0.05 for TCDD compared with vehicle within a genotype; **, p < 0.05 for Scd1+/+ TCDD compared with Scd1/ TCDD; ***, p < 0.05 for Scd1+/+ vehicle compared with Scd1/ vehicle. Data were analyzed by factorial ANOVA followed by Tukey’s post hoc test.
FIG. 5.
FIG. 5.
Scd1 activity, mRNA, and protein levels in Scd1+/+ and Scd1/ mice treated with 30 μg/kg TCDD (T) or sesame seed oil (V) 24 h postdose. (A) Scd1 activity. Hepatic microsomes (100 μg, n = 5) isolated from mice were incubated with 0.03 μCi 14C-stearoyl-CoA (14C 18:0), NADH, and stearoyl-CoA. 14C 18:0 was separated from 14C 18:1 by silver ion chromatography and radioactivity measured by scintillation counting. Scd1 activity is expressed as nmol 14C 18:0 converted to 14C 18:1 per mg Scd1 protein per min. (B) QRT-PCR of Scd1 mRNA (n = 5). Expression is represented as a ratio of the total quantity of Scd1 normalized to the geometric mean of Hprt, Actb, and Gapdh. (C) Scd1 Western blot. Hepatic Scd1 protein (n = 3) was detected in 10 μg of microsomes. Epxh1 was used as a microsomal protein reference for loading control. (D) Densitometry. Densitometry was determined with ImageJ from Scd1 bands and normalized to Ephx1 bands. ‡ p = 0.08. For A, B, and D bars represent mean ± SEM, *, p < 0.05 for T compared with V within a genotype; **, p < 0.05 for Scd1/ T compared with Scd1+/+ T within a time point; ***, p < 0.05 for Scd1/ V compared with Scd1+/+ V within a time point. Data were analyzed by factorial ANOVA followed by Tukey’s post hoc test.
FIG. 6.
FIG. 6.
DRE distribution and TCDD-inducible AhR enrichment within Scd loci. (A) Genomic region spanning Scd1, Scd2, Scd3, and Scd4. (B) Scd1 genomic region only. Genomic DRE distributions and regions of AhR enrichment induced by TCDD were previously determined (Dere et al., 2011a; Dere et al., 2011b). Track 1: scale and chromosome position. Track 2: probe tiling across the Affymetrix 2.0R mouse array. Track 3: gene organization including TSS (closed arrow), exons (closed boxes), introns, and direction of transcription (solid arrowhead line). Track 4: location of DRE cores (5′-GCGTG-3′). Height of vertical bars indicate MSS for the 19 bp DRE sequence (Dere et al., 2011a). The horizontal line indicates the MSS = 0.8. MSSs greater than 0.8 are considered putative functional DREs. The asterisk (*) denotes 19 bp DRE sequences that bound TCDD-activated AhR in band shift assays. Track 5: regions of significant (FDR < 0.01) AhR enrichment in genome-wide ChIP-chip assays. Tracks 6 and 7: histograms depicting the signal intensities for the MA(blue, track 6) and log2 fold enrichment (green, track 7) values for regions exhibiting AhR enrichment in genome-wide ChIP-chip assays. The above tracks were modified from the University of California–Santa Cruz genome browser. (B) Scd1 genomic region only. Track 4: yellow shading, putative DRE-AhR enrichment overlap; purple shading, putative DREs lacking Affymetrix tiling probes; gray shading, putative DREs that do not overlap with AhR enrichment; and green shading, putative DRE in an AhR region that failed to meet the FDR cutoff of 0.01. Track 5: orange shading, AhR-enriched regions that do not overlap with putative DREs. (C) Representative band shift assays with putative, functional DREs (track 4, asterisks [*]). The DRE position is numerically indicated relative to the Scd1 TSS. Solid arrows indicate a TCDD-inducible band shift. Hatched or dashed arrows indicate an AhR or ARNT supershift, respectively.

References

    1. Anstee QM, Goldin RD. Mouse models in non-alcoholic fatty liver disease and steatohepatitis research. Int. J. Exp. Pathol. 2006;87:1–16. - PMC - PubMed
    1. Attie AD, Flowers MT, Flowers JB, Groen AK, Kuipers F, Ntambi JM. Stearoyl-CoA desaturase deficiency, hypercholesterolemia, cholestasis, and diabetes. Nutr. Rev. 2007;65:S35–S38. - PubMed
    1. Attie AD, Krauss RM, Gray-Keller MP, Brownlie A, Miyazaki M, Kastelein JJ, Lusis AJ, Stalenhoef AF, Stoehr JP, Hayden MR, et al. Relationship between stearoyl-CoA desaturase activity and plasma triglycerides in human and mouse hypertriglyceridemia. J. Lipid Res. 2002;43:1899–1907. - PubMed
    1. Bank PA, Yao EF, Phelps CL, Harper PA, Denison MS. Species-specific binding of transformed Ah receptor to a dioxin responsive transcriptional enhancer. Eur. J. Pharmacol. 1992;228:85–94. - PubMed
    1. Bank PA, Yao EF, Swanson HI, Tullis K, Denison MS. DNA binding of the transformed guinea pig hepatic Ah receptor complex: Identification and partial characterization of two high-affinity DNA-binding forms. Arch. Biochem. Biophys. 1995;317:439–448. - PubMed

Publication types

MeSH terms