

Viremia copy-years predicts mortality among treatment-naive HIV-infected patients initiating antiretroviral therapy
- PMID: 21890751
- PMCID: PMC3189165
- DOI: 10.1093/cid/cir526
Viremia copy-years predicts mortality among treatment-naive HIV-infected patients initiating antiretroviral therapy
Abstract
Background: Cross-sectional plasma human immunodeficiency virus (HIV) viral load (VL) measures have proven invaluable for clinical and research purposes. However, cross-sectional VL measures fail to capture cumulative plasma HIV burden longitudinally. We evaluated the cumulative effect of exposure to HIV replication on mortality following initiation of combination antiretroviral therapy (ART).
Methods: We included treatment-naive HIV-infected patients starting ART from 2000 to 2008 at 8 Center for AIDS Research Network of Integrated Clinical Systems sites. Viremia copy-years, a time-varying measure of cumulative plasma HIV exposure, were determined for each patient using the area under the VL curve. Multivariable Cox models were used to evaluate the independent association of viremia copy-years for all-cause mortality.
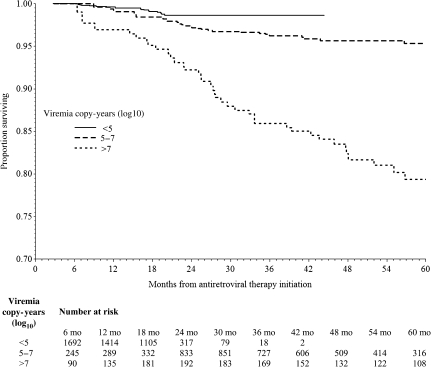
Results: Among 2027 patients contributing 6579 person-years of follow-up, the median viremia copy-years was 5.3 log₁₀ copy × y/mL (interquartile range: 4.9-6.3 log₁₀ copy × y/mL), and 85 patients (4.2%) died. When evaluated separately, viremia copy-years (hazard ratio [HR] = 1.81 per log₁₀ copy × y/mL; 95% confidence interval [CI], 1.51-2.18 per log(10) copy × y/mL), 24-week VL (1.74 per log₁₀ copies/mL; 95% CI, 1.48-2.04 per log₁₀ copies/mL), and most recent VL (HR = 1.89 per log₁₀ copies/mL; 95% CI: 1.63-2.20 per log₁₀ copies/mL) were associated with increased mortality. When simultaneously evaluating VL measures and controlling for other covariates, viremia copy-years increased mortality risk (HR = 1.44 per log₁₀ copy × y/mL; 95% CI, 1.07-1.94 per log₁₀ copy × y/mL), whereas no cross-sectional VL measure was independently associated with mortality.
Conclusions: Viremia copy-years predicted all-cause mortality independent of traditional, cross-sectional VL measures and time-updated CD4+ T-lymphocyte count in ART-treated patients, suggesting cumulative HIV replication causes harm independent of its effect on the degree of immunodeficiency.
Figures
References
-
- Mellors JW, Kingsley LA, Rinaldo CR, Jr, et al. Quantitation of HIV-1 RNA in plasma predicts outcome after seroconversion. Ann Intern Med. 1995;122:573–9. - PubMed
-
- Mellors JW, Rinaldo CR, Jr, Gupta P, White RM, Todd JA, Kingsley LA. Prognosis in HIV-1 infection predicted by the quantity of virus in plasma. Science. 1996;272:1167–70. - PubMed
-
- Saag MS, Holodniy M, Kuritzkes DR, et al. HIV viral load markers in clinical practice. Nat Med. 1996;2:625–9. - PubMed
-
- Piatak M, Jr, Saag MS, Yang LC, et al. High levels of HIV-1 in plasma during all stages of infection determined by competitive PCR. Science. 1993;259:1749–54. - PubMed
-
- Eron JJ, Benoit SL, Jemsek J, et al. Treatment with lamivudine, zidovudine, or both in HIV-positive patients with 200 to 500 CD4+ cells per cubic millimeter. North American HIV Working Party. N Engl J Med. 1995;333:1662–9. - PubMed
Publication types
MeSH terms
Substances
Grants and funding
- P30 AI027767/AI/NIAID NIH HHS/United States
- K01-AI071754/AI/NIAID NIH HHS/United States
- R01HS018731/HS/AHRQ HHS/United States
- R21 AI087360/AI/NIAID NIH HHS/United States
- R24 AI067039/AI/NIAID NIH HHS/United States
- 1R21AI087360-01/AI/NIAID NIH HHS/United States
- P30 AI027757/AI/NIAID NIH HHS/United States
- P30-AI027767/AI/NIAID NIH HHS/United States
- P30 AI050410/AI/NIAID NIH HHS/United States
- 1R24AI067039-04/AI/NIAID NIH HHS/United States
- R01 HS018731/HS/AHRQ HHS/United States
- K01 AI071754/AI/NIAID NIH HHS/United States
- P30-AI50410/AI/NIAID NIH HHS/United States
- P30 AI027763/AI/NIAID NIH HHS/United States
- U01 AI069918/AI/NIAID NIH HHS/United States
LinkOut - more resources
Full Text Sources
Other Literature Sources
Medical
Research Materials
