

doi: 10.1038/nn.2909.
miR-132, an experience-dependent microRNA, is essential for visual cortex plasticity
Affiliations
- PMID: 21892155
- PMCID: PMC3183341
- DOI: 10.1038/nn.2909
Item in Clipboard
miR-132, an experience-dependent microRNA, is essential for visual cortex plasticity
Nat Neurosci.
.
Abstract
Using quantitative analyses, we identified microRNAs (miRNAs) that were abundantly expressed in visual cortex and that responded to dark rearing and/or monocular deprivation. The most substantially altered miRNA, miR-132, was rapidly upregulated after eye opening and was delayed by dark rearing. In vivo inhibition of miR-132 in mice prevented ocular dominance plasticity in identified neurons following monocular deprivation and affected the maturation of dendritic spines, demonstrating its critical role in the plasticity of visual cortex circuits.
© 2011 Nature America, Inc. All rights reserved.
Figures
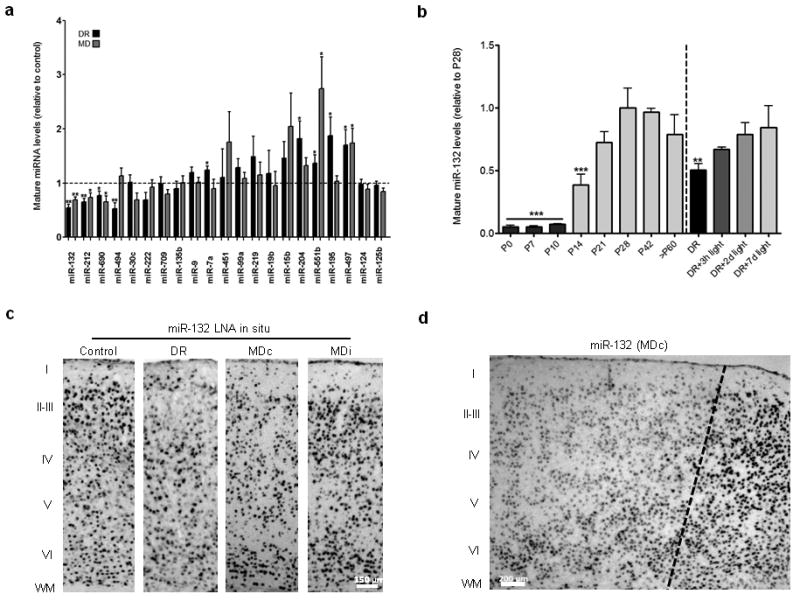
Experience-dependent miRNAs in mouse visual cortex, and detailed analysis of miR-132. (a) Graph showing mean ± S.E.M. relative to control DR and MD ratios with mature miRNA-specific qRT-PCR. One asterisk denotes P < 0.05 and two asterisks P < 0.01, based on two-tailed one-sample Student's t test. (b) Graph showing mean ± S.E.M. relative miRNA levels (normalized to control P28 mean) based on mature miRNA-specific qRT-PCR during development of V1, as well as after different durations of light exposure in DR mice. One asterisk denotes P < 0.05, and two asterisks P < 0.01, based on ANOVA with Dunnett's test for multiple comparisons relative to control P28. (c) Representative images from LNA in situ hybridization of miR-132 in V1 at P28 in control, DR, and MD cases both contralateral (MDc) and ipsilateral (MDi) to the sutured eye. (d) LNA in situ hybridization for miR-132 in the medial edge of contralateral V1 (marked by dotted line).
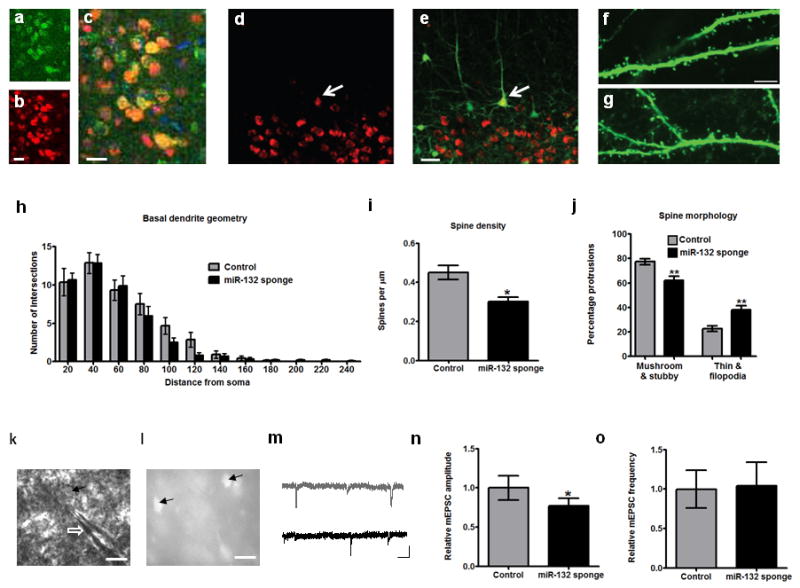
Structural and electrophysiological effects of miR-132 inhibition. (a-c) Expression of (a) p250GAP, (b) mCherry, as well as their (c) co-localization in mCherry-miR-132 sponge-expressing neurons. DAPI staining is seen in blue in (c). Scale bars = 25 μm. (d-e) Confocal microscope images from GFP-S transgenic mice showing layer 5 mCherry-miR-132 sponge-expressing neurons. mCherry expression is shown in (d), and co-localization with GFP in (e). White arrows point to mCherry and GFP positive neuron used for structural analysis. Scale bar = 50 μm. (f-g) Representative confocal images from secondary dendritic branches of (f) control and (g) miR-132 sponge-infected layer 5 pyramidal neurons used for spine analysis. Scale bar = 5 μm. (h-j) Results (all shown as mean ± S.E.M.) from analysis of (h) dendritic arborization (Sholl analysis), (i) spine density, and (j) spine morphology of sponge-infected and control neurons. One asterisk denotes P < 0.05 and two asterisks P < 0.01, based on two-tailed Student's t test. (k) DIC image showing whole-cell patched pyramidal neuron (arrow) in layer 2/3 of mouse V1. Shadow of patch pipette marked by white open arrow. Scale bar = 20 μm. (l) Image of the same slice showing miR-132 sponge-infected cells (arrows). Scale bar = 40 μm. (m) Representative traces showing mEPSCs recorded from miR-132 sponge-infected and non-infected cells (shown in black and gray, respectively). Scale bar denotes 20 pA, 0.5 sec. (n-o) Histogram showing (n) mean ± S.E.M. amplitude and (o) frequency of mEPSCs recorded from control non-infected (gray) and infected neurons (black; n=9 neurons per group).
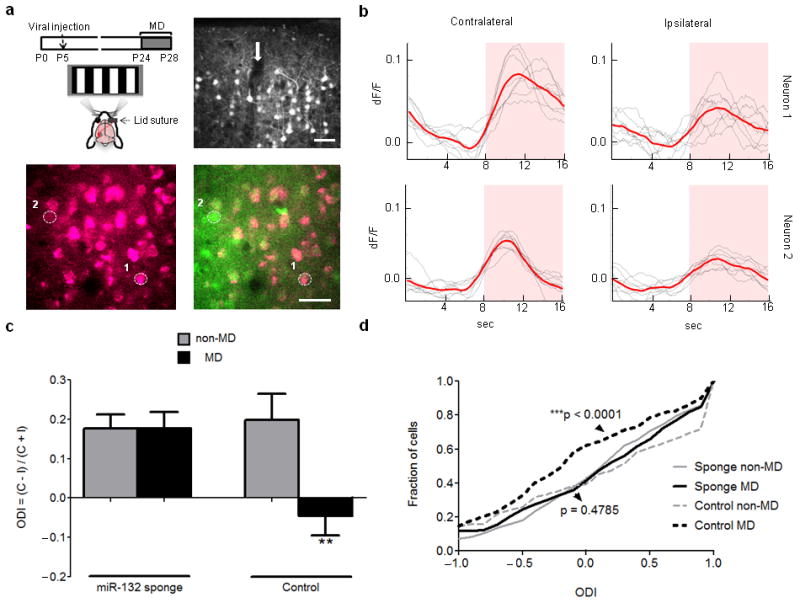
In vivo inhibition of miR-132 in V1 neurons disrupts their ocular dominance plasticity. (a) Top left: Schematic of experimental design. Top right: Images from confocal microscopy showing mCherry expression in cortical layers 1-3 at P28 following neonatal injection (arrow) of mCherry-miR-132 sponge-expressing lentivirus. Bottom: Two-photon microscope image showing mCherry expression alone (left) and its overlay with OGB (green) fluorescence (right) in an injected animal that underwent MD; selected neurons used for (b) are circled and numbered. Scale bars = 40 μm. (b) Example of contralateral and ipsilateral eye-driven calcium responses of the neurons shown in (a) that express high (top – neuron 1) or low (bottom - neuron 2) levels of mCherry-miR-132 sponge. Pink shaded area indicates period with visual stimulus. Calculated ODIs are: 0.73 (top – neuron 1), and 0.55 (bottom – neuron 2). (c) Ocular Dominance Index values (ODI = (contra – ipsi) / (contra + ipsi); mean ± S.E.M.) derived from peak visual responses obtained by two-photon calcium imaging in mice injected with mCherry-miR-132 sponge-expressing lentivirus. Black bars show animals subjected to 4 day MD and light gray bars show animals not subjected to MD: miR-132 sponge non-MD: 5 animals, 290 neurons; miR-132 sponge MD: 4 animals, 232 neurons; control non-MD: 3 animals, 120 neurons; control MD: 3 animals, 177 neurons. Note the lack of ODI shift following MD for mice that were injected with miR-132 sponge but not control virus. Control MD animals show a significantly larger ocular dominance shift compared to each of the other conditions (P < 0.01, Mann-Whitney test comparing neurons; P < 0.05 treating each animal as a single datum). (d) Cumulative histogram of ODI data shown in (c). There is a significant difference between control MD and non-MD neurons (black and light gray dotted lines respectively), but not between miR-132 sponge-infected MD and non-MD neurons (black and light gray lines, respectively). P-values shown are based on Kolmogorov–Smirnov test.
References
Publication types
MeSH terms
Substances
Associated data
- Actions
Grants and funding
LinkOut - more resources
Full Text Sources
Molecular Biology Databases
