. 2011 Sep 4;43(10):932-9.
doi: 10.1038/ng.924.

Oncogenic IL7R gain-of-function mutations in childhood T-cell acute lymphoblastic leukemia

Affiliations

Oncogenic IL7R gain-of-function mutations in childhood T-cell acute lymphoblastic leukemia

Priscila P Zenatti et al. Nat Genet. .

Abstract

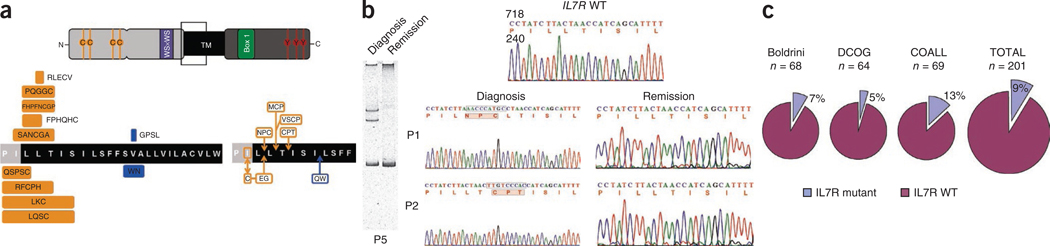
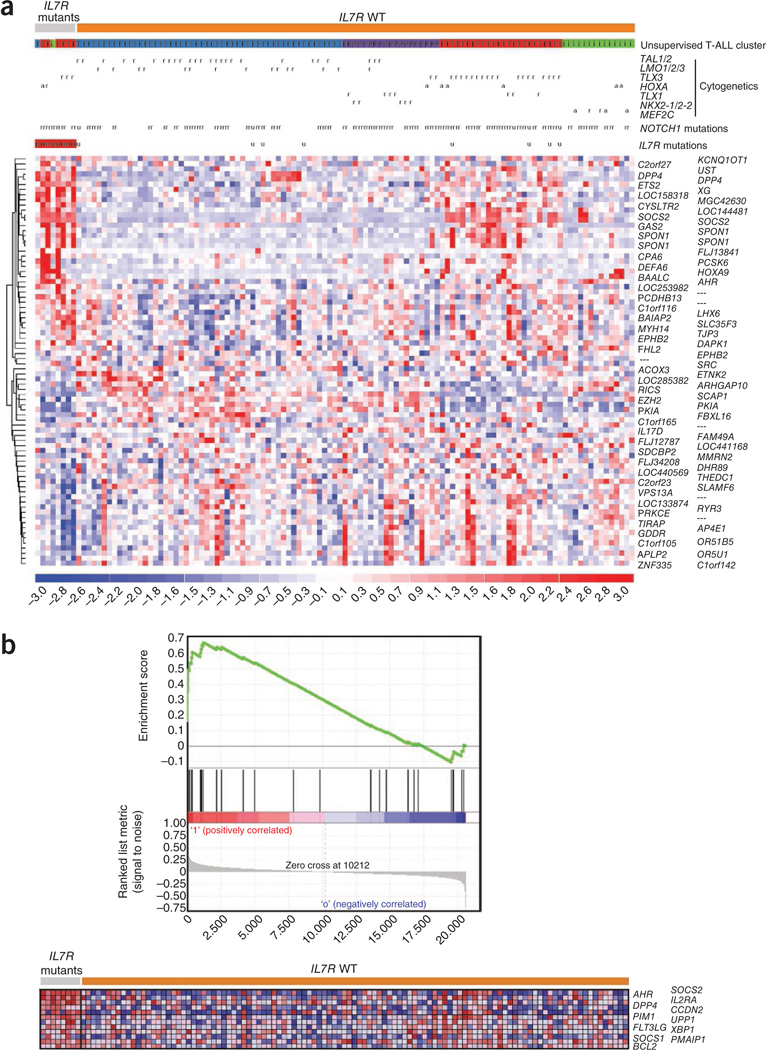
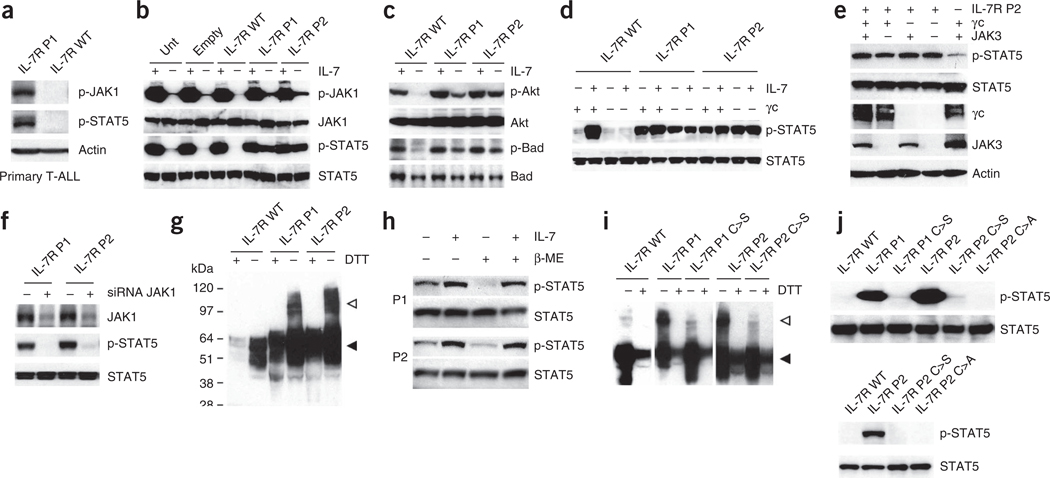
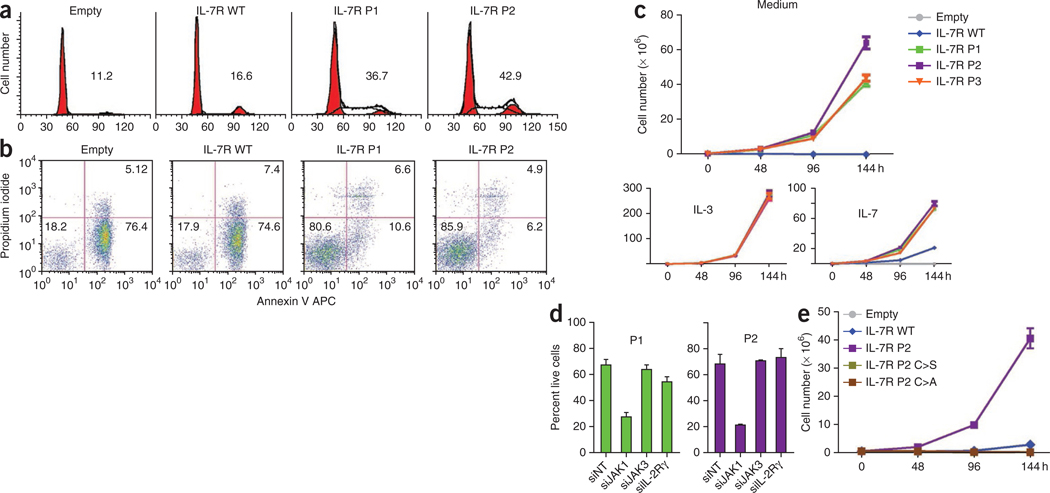
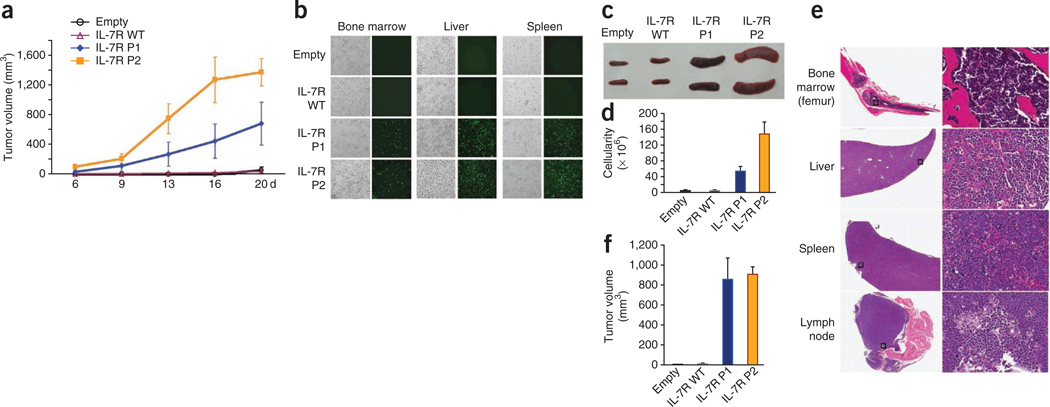
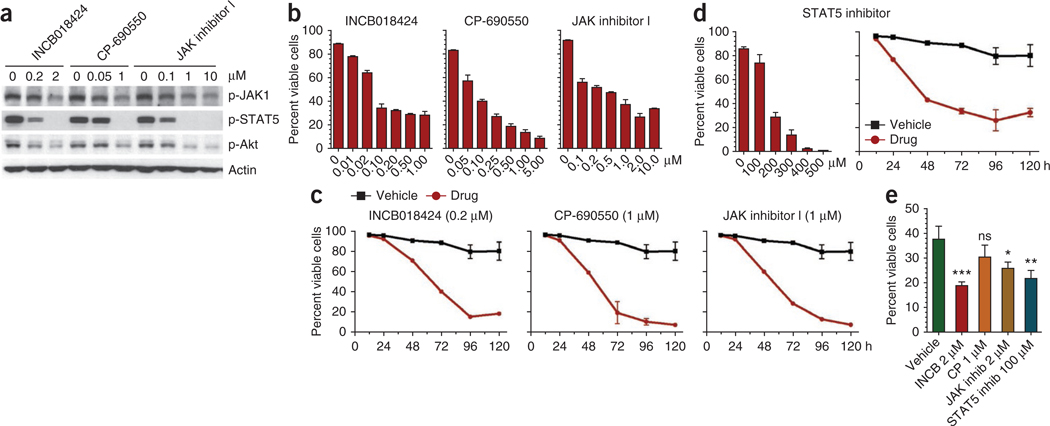
Interleukin 7 (IL-7) and its receptor, formed by IL-7Rα (encoded by IL7R) and γc, are essential for normal T-cell development and homeostasis. Here we show that IL7R is an oncogene mutated in T-cell acute lymphoblastic leukemia (T-ALL). We find that 9% of individuals with T-ALL have somatic gain-of-function IL7R exon 6 mutations. In most cases, these IL7R mutations introduce an unpaired cysteine in the extracellular juxtamembrane-transmembrane region and promote de novo formation of intermolecular disulfide bonds between mutant IL-7Rα subunits, thereby driving constitutive signaling via JAK1 and independently of IL-7, γc or JAK3. IL7R mutations induce a gene expression profile partially resembling that provoked by IL-7 and are enriched in the T-ALL subgroup comprising TLX3 rearranged and HOXA deregulated cases. Notably, IL7R mutations promote cell transformation and tumor formation. Overall, our findings indicate that IL7R mutational activation is involved in human T-cell leukemogenesis, paving the way for therapeutic targeting of IL-7R-mediated signaling in T-ALL.


Figures

Figure 1
Figure 1
IL7R exon 6 somatic mutations in pediatric T-ALL. (a) Scheme of IL-7Rα protein (top) and predicted amino acid alterations (bottom). Indicated are the two extracellular fibronectin type III–like domains containing four paired cysteines and a WS×WS motif, the transmembrane domain and the cytoplasmic tail with the Box 1 motif and the tyrosine residues involved in signal transduction. The region where the mutations occur is denoted by an empty box. Amino acid changes involving de novo introduction of a cysteine are indicated in orange; filled boxes denote deletions-insertions and are aligned with the respective deleted amino acid sequence; arrows point to where simple insertions occur. (b) Representative homoduplex and heteroduplex analysis of PCR products (left) and sequencing chromatograms (right) of paired diagnosis and remission samples indicating the somatic, tumor-associated origin of exon 6 mutations. (c) Frequency of T-ALL mutations in the three different case cohorts analyzed.
Figure 2
Figure 2
Molecular signatures associated with IL7R mutations in T-ALL. (a) Heat-map diagram of the 80 top ranking differentially expressed genes (supplementary table 1) in IL7R mutant (n = 8) compared to wild-type (n = 109) T-ALLs as determined by empirical Bayes linear models (LIMMA package; cutoff false discovery rate P = 0.05). Genes are shown in rows; each individual sample is shown in one column The scale bar shows color-coded differential expression from the mean in s.d. units, with red indicating higher expression and blue indicating lower expression. Unsupervised gene expression T-ALL clusters were defined as previously described and are indicated as: T (blue), TAL/LMO; T (red), TLX; i (green), immature; and P (violet), proliferative. Cytogenetic defects are denoted as: r, rearranged or mutated; a, aberrant expression; and u, unavailable data. (b) Gene set enrichment analysis (GSEA) plot (top) showing that genes overexpressed in human normal lymphocytes following IL-7 exposure were significantly enriched in IL7R mutant T-ALL cases (enrichment score = 0.67, P = 0.045). Heat-map diagram (bottom) of the 12 top-ranking genes in the leading edge.
Figure 3
Figure 3
IL7R mutations induce constitutive signaling in a manner that is independent of IL-7, γc and JAK3 and relies on disulfide bond promotion of homodimer formation. (a) We analyzed primary T-ALL cells collected at diagnosis from cases with mutant (P1) and wild-type IL7R by immunoblot for JAK1 and STAT5 phosphorylation. (b,c) We cultured D1 cells expressing human wild-type or mutant (P1 and P2) IL-7Rα without IL-7 for 4 h, stimulated them or not with IL-7 for 20 min and evaluated them for activation of JAK-STAT (b) and PI3K-Akt (c) pathway activation by immunoblot. (d) We analyzed 293T cells reconstituted with JAK3, STAT5 and wild-type or mutant IL-7Rα, and expressing or not expressing γc, for constitutive and IL-7–induced (15 min stimulation) STAT5 phosphorylation. (e) We transfected 293T cells with IL-7Rα P2 and the remaining components of the IL-7R signaling machinery as indicated and evaluated them for STAT5 phosphorylation. (f) We transfected 293T cells with IL-7Rα P1 or P2 and small interfering RNA (siRNA) against JAK1 (+) or control non-targeting siRNA (−) and evaluated them after 36 h for JAK1 expression and STAT5 phosphorylation. (g) Lysates from D1 cells expressing wild-type or mutant IL-7Rα were treated or untreated with the reducing agent DTT and analyzed for IL-7Rα expression by immunoblot. The monomeric and dimeric forms of the receptor are denoted by black and white arrowheads, respectively. (h) We pretreated 293T cells expressing IL-7Rα P1 and P2 and the remaining components of the IL-7R signaling machinery with β-mercaptoethanol (β-ME), stimulated or unstimulated them with IL-7 for 15 min and subsequently evaluated them for STAT5 phosphorylation by immunoblot. (i) We analyzed the D1 cells expressing each of the indicated IL-7R constructs for IL-7Rα expression by immunoblot. (j) We assessed the signaling elicited by each indicated mutant form expressed in D1 (top) or 293T (bottom) cells by detection of STAT5 phosphorylation.
Figure 4
Figure 4
IL7R mutations induce cell-cycle progression, increase cell viability and promote growth factor independence. (a,b) We cultured Ba/F3 cells stably expressing wild-type or mutant IL-7Rα for 96 h in medium and analyzed them for (a) cell cycle distribution (percentage of cells in cycle (S+G2/M) is indicated for each condition) and (b) viability (percentage of viable, early apoptotic and late apoptotic or necrotic cells is indicated in the respective quadrant). (c) We cultured Ba/F3 cells stably expressing IL-7Rα in the absence of growth factors or with IL-3 or IL-7 and measured expansion at the indicated time points. (d) We transfected Ba/F3 cells stably expressing P1 or P2 mutant IL-7Rα with siRNA against JAK1, JAK3, γc (IL-2Rγ) or with non-targeting (NT) control and evaluated them for cell viability after 48 h. (e) We cultured Ba/F3 cells transduced with IL-7Rα P2 or with the indicated introduced mutations in the absence of growth factors and measured expansion at the indicated time points. Results in ce represent the average of triplicates ± s.e.m.
Figure 5
Figure 5
In vivo tumorigenic effect of IL7R mutations. We subcutaneously injected D1 cells expressing wild-type or mutant IL-7Rα into Rag1−/− mice and evaluated them for tumor progression and organ infiltration. (a) Subcutaneous tumor volume growth curves. (b) Phase contrast and fluorescence imaging of D1 cells (GFP-positive) infiltrated into liver, spleen and bone marrow. (c) Representative images of spleens from mice culled at day 20 and (d) respective spleen cellularity. (e) Histological analysis (hematoxylin and eosin staining) of |indicated organs from a representative mouse transplanted with cells expressing mutant IL-7Rα P2; the right panel shows a 20× magnification of the area denoted by a square on the left panel. (f) We subcutaneously injected D1 cells expressing wild-type or mutant IL-7Rα into Il7−/− Rag2−/− mice and evaluated them for tumor size at day 20. Results in a, d and f represent the average of triplicates ± s.e.m.
Figure 6
Figure 6
Targeting IL7R mutants using JAK-STAT pathway inhibitors. We cultured Ba/F3 cells expressing mutant IL-7Rα P1 in medium alone in the presence or absence of the indicated doses of different JAK and STAT5 pharmacological inhibitors. (a) We analyzed the cells at 48 h for effective JAK-STAT pathway inhibition by immunoblot. (b,c) We analyzed cell viability (b) at 48 h (INCB018424) and 72 h (CP-690550 and JAK inhibitor 1) after increasing doses of each drug and (c) at different time points with a single dose of each inhibitor. (d) We analyzed cell viability at 72 h with increasing doses or at different culture time points with 200 ~M of STAT5-specific inhibitor. (e) We cultured primary T-ALL cells from subject P1 in the presence of the indicated JAK-STAT pathway inhibitors and evaluated them for cell viability at 24 h. Ns, P ≥ 0.05; *P < 0.05; **P < 0.01; ***P < 0.001. Viability results in be represent the average of triplicates ± s.e.m.

References

    1. Jiang Q et al. Cell biology of IL-7, a key lymphotrophin. Cytokine Growth Factor Rev. 16, 513–533 (2005). - PubMed
    1. Fry TJ & Mackall CL The many faces of IL-7: from lymphopoiesis to peripheral T cell maintenance. J. Immunol. 174, 6571–6576 (2005). - PubMed
    1. von Freeden-Jeffry U et al. Lymphopenia in interleukin (IL)-7 gene-deleted mice identifies IL-7 as a nonredundant cytokine. J. Exp. Med. 181, 1519–1526 (1995). - PMC - PubMed
    1. Peschon JJ et al. Early lymphocyte expansion is severely impaired in interleukin 7 receptor–deficient mice. J. Exp. Med. 180, 1955–1960 (1994). - PMC - PubMed
    1. Puel A, Ziegler SF, Buckley RH & Leonard WJ Defective IL7R expression in T(−)B(+)NK(+) severe combined immunodeficiency. Nat. Genet. 20, 394–397 (1998). - PubMed

Publication types

MeSH terms