. 2011 Sep 4;12(10):966-74.
doi: 10.1038/ni.2096.

Invariant natural killer T cells recognize glycolipids from pathogenic Gram-positive bacteria

Affiliations

Invariant natural killer T cells recognize glycolipids from pathogenic Gram-positive bacteria

Yuki Kinjo et al. Nat Immunol. .

Abstract

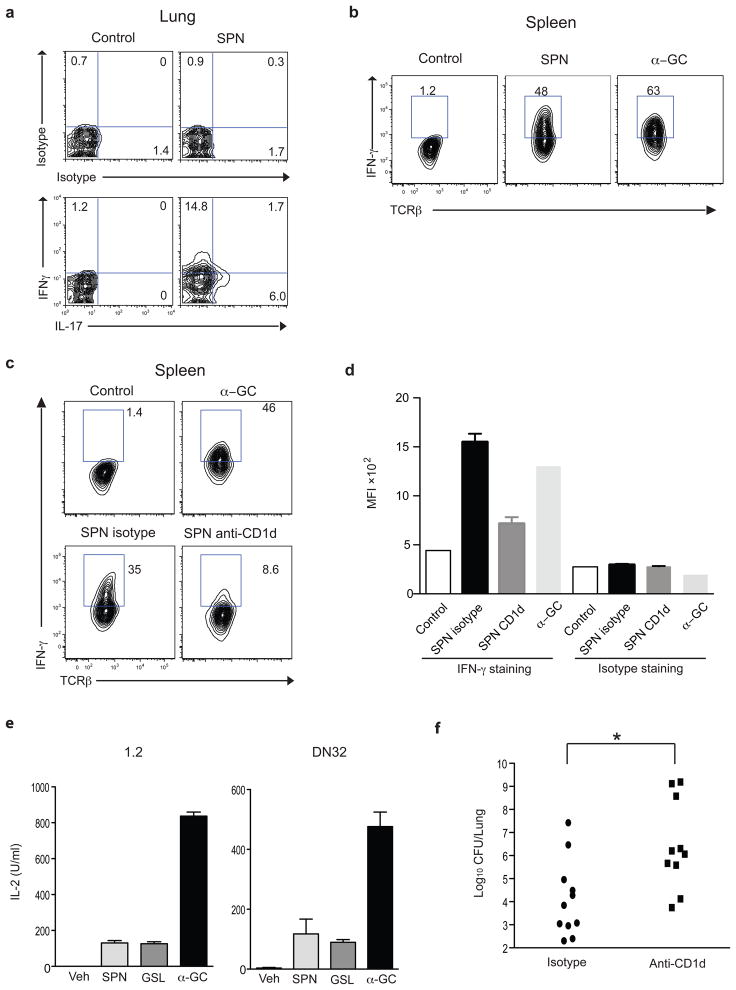
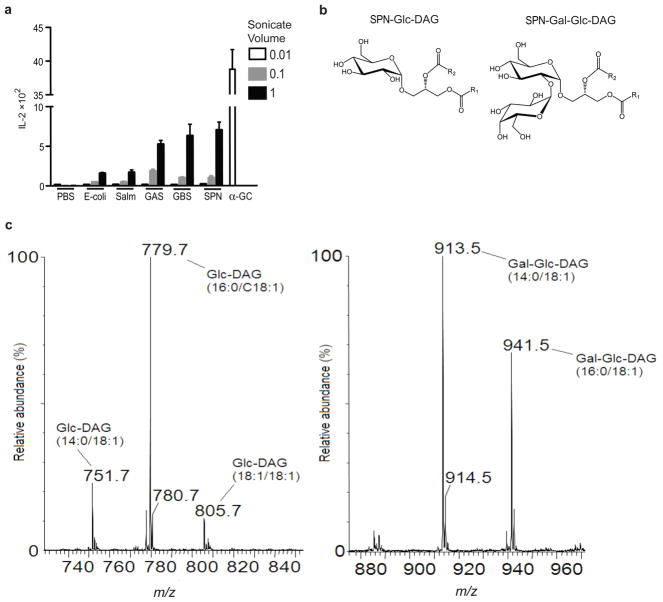
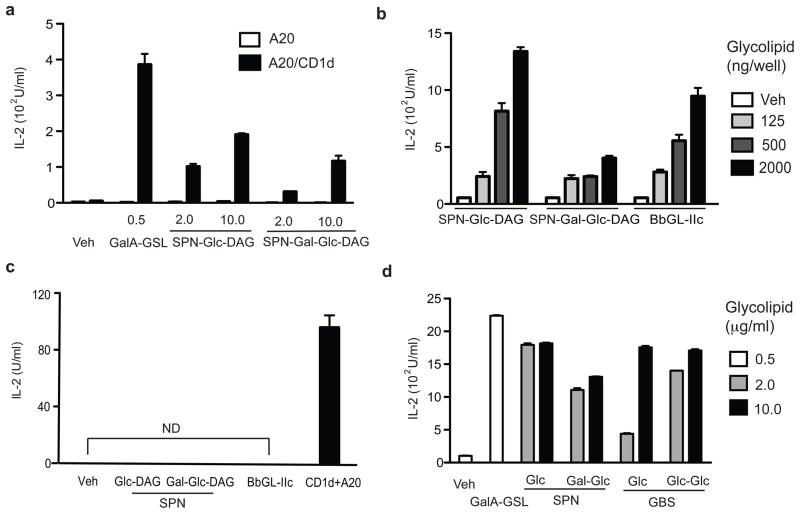
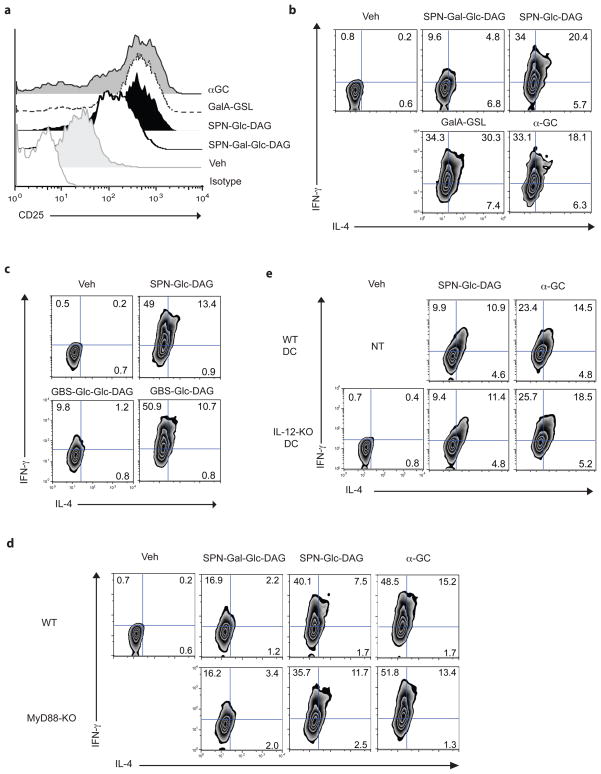
Natural killer T cells (NKT cells) recognize glycolipid antigens presented by CD1d. These cells express an evolutionarily conserved, invariant T cell antigen receptor (TCR), but the forces that drive TCR conservation have remained uncertain. Here we show that NKT cells recognized diacylglycerol-containing glycolipids from Streptococcus pneumoniae, the leading cause of community-acquired pneumonia, and group B Streptococcus, which causes neonatal sepsis and meningitis. Furthermore, CD1d-dependent responses by NKT cells were required for activation and host protection. The glycolipid response was dependent on vaccenic acid, which is present in low concentrations in mammalian cells. Our results show how microbial lipids position the sugar for recognition by the invariant TCR and, most notably, extend the range of microbes recognized by this conserved TCR to several clinically important bacteria.


Conflict of interest statement

The authors declare no competing financial interests.

Figures

Figure 1
Figure 1. CD1d-dependent cytokine production by Vα14i NKT cells
(a) Expression of intracellular IFN-γ and IL-17 by α̃GalCer loaded CD1d tetramer+ CD19- lung MNC measured 13h after intratracheal SPN infection. (b) Expression of intracellular IFN-γ by tetramer+ CD19 spleen cells at 6h after i, v, SPN infection. (c, d) Expression of intracellular IFN-γ by tetramer+ CD19 spleen cells at 6h after intravenous SPN infection in mice treated with an anti-CD1d Ab or isotype control. α̃GalCer was administered 1.5 hrs before tissue harvest. Representative data from cells combined from at least five mice (a) or from a control and a α̃GalCer injected mouse and one of three (SPN) mice (b–c) are shown. Similar results were obtained from at least two experiments. (e) Stimulation of Vα14i NKT cell hybridoma clones 1.2 and DN32 with CD11c+ cells from spleen of mice infected 16h earlier. IL-2 was measured by ELISA. Each bar shows mean ± SEM from triplicate wells. Representative data from two independent experiments are shown. (f) Lung CFU of mice treated with either anti-CD1d Ab or isotype control IgG at 3 days after SPN infection. Each symbol represents an individual mouse. Combined data from two independent experiments are shown. *; p<0.05 (Mann-Whitney test).
Figure 2
Figure 2. Structure of SPN glycolipids
(a) Sonicates of GAS (group A Streptococcus), GBS (group B Streptococcus), SPN (S. pneumoniae) and of two Gram-negative bacteria, E. coli and Salm (Salmonella typhimurium), PBS or α̃GalCer (α̃GC: 5ng/well) were tested in an APC-free assay with Vα14i NKT cell hybridoma 1.2. IL-2 in the culture supernatant was measured by ELISA. The amount of sonicates 0.01, 0.1 and 1 was equivalent to 106, 107, 108 bacteria/well, respectively. Each bar shows mean ± SEM from triplicate wells. (b) Structure of two glycolipids from SPN. One with a single glucose α linked to DAG is SPN glucosyl (Glc) diacylglycerol (DAG) (SPN-Glc-DAG). A second glycolipid contains a disaccharide attached to DAG, with galactose (Gal) α1→2 linked to the glucose sugar (SPN-Gal-Glc-DAG). (c) Electro-spray ionization mass spectrometry analysis of glycolipids with the fatty acid compositions shown in the brackets: SPN-Glc-DAG (left) and SPN-Gal-Glc-DAG (right).
Figure 3
Figure 3. Microbial glycolipids stimulate Vα14i NKT cells in vitro
(a, b) CD1d-dependent stimulation of Vα14i NKT cell hybridomas by SPN-Glc-DAG and SPN-Gal-Glc-DAG. (a) Cells from Vα14i NKT cell hybridoma 1.2 were cultured with A20 cells (APC) or mouse CD1d transfected A20 cells (A20-CD1d) pulsed with SPN-Glc-DAG (Glc-DAG), SPN-Gal-Glc-DAG (Gal-Glc-DAG) or Sphingomonas GalA-GSL at the indicated concentrations (μg/ml). IL-2 release was measured 20h. (b) The indicated concentrations (ng/well) of SPN-Glc-DAG, SPN-Gal-Glc-DAG or B. burgdorferi glycolipid BbGL-IIc were incubated in wells coated with mouse CD1d and 1.2 hybridoma cells were cultured in the wells for 20h before measuring IL-2 release. (c) Non-Vα14 expressing but CD1d reactive 19 hybridoma cells did not respond to microbial glycolipids (2000 ng/well) in wells coated with CD1d. The 19 hybridoma cells responded to a self-antigen presented by mouse CD1d transfected A20 cells by releasing IL-2. ND; not detected. (d) Two glycolipids from GBS stimulate Vα14i NKT cells. 1.2 hybridoma cells were cultured with A20-CD1d cells that had been pulsed with GBS glycolipids Glc-DAG (Glc) or Glc-Glc-DAG (Glc-Glc) at the indicated concentrations (μg/ml). Each bar shows mean ± SEM from triplicate wells. Representative data from at least two (c) or three (a, b, d) experiments are shown.
Figure 4
Figure 4. In vivo stimulation of Vα14i NKT cells by purified glycolipids
(a, b) SPN-Glc-DAG and SPN-Gal-Glc-DAG stimulate expression of CD25 (a) and intracellular cytokines (b) by tetramer+ Vα14i NKT cells. Liver MNC were analyzed 14h after transfer of DCs that had been pulsed with SPN-Gal-Glc-DAG, SPN-Glc-DAG, sphingomonas GalA-GSL or α̃GalCer (20, 20, 10 or 0.1 μg/ml, respectively). (c) Expression of intracellular cytokines by tetramer+ liver MNC at 14h after transfer of DCs that had been pulsed with vehicle (veh), SPN-Glc-DAG, or GBS glycolipids GBS-Glc- DAG or GBS-Glc-Glc-DAG (20 μg/ml). (d) Intracellular IFN-γ and IL-4 expression byα̃GalCer loaded CD1d tetramer positive liver MNC of WT or Myd88−/− mice at 14h after transfer of Myd88−/− -Triflps2/lps2 DCs pulsed with the indicated purified S. pneumoniae antigens (20 μg/ml) or positive control antigen α̃GalCer (α̃GC, 0.1 μg/ml). (e) Expression of intracellular cytokines by tetramer+ liver MNC measured at 4h after transfer into Il12p35−/− mice of Il12p35−/− or WT DCs that had been pulsed with SPN-Glc-DAG, or α̃GalCer (20 or 0.1 μg/ml, respectively). (a–e) Representative data from one of 2 (α̃GalCer in d) or 3 (other panels) mice are shown. Similar results were obtained from at least two independent experiments.
Figure 5
Figure 5. Stringent requirement for vaccenic acid for stimulating iNKT cells
(a, b) Expression of CD25 (a) and intracellular cytokines (b) by tetramer+ liver MNC measured at 14h after transfer of DCs that had been pulsed with vehicle (veh), synthetic variants of Glc-DAG (20 μg/ml) or α̃GalCer (0.1 μg/ml). Representative data from one of at least three mice are shown. Similar results were obtained from two experiments. (c) Human Vα24i NKT cells recognize purified and synthetic SPN glycolipids. Vα24i NKT cell lines were cultured with human CD1d transfected Hela cells for 24h in the presence of the indicated purified (Glc-DAG and Gal-Glc-DAG) or synthetic glycolipids (μg/ml). Each bar shows mean ± SD from triplicate wells. Representative data from one of five Vα24i NKT cell lines tested are shown.
Figure 6
Figure 6. Crystal structure of the mouse CD1d-Glc-DAG-s2 complex
(a) Conformation of Glc-DAG-s2 in the binding groove. A side view with the α2 helix removed for clarity and the 2Fo-Fc electron density for the ligand (1σ) as a blue mesh. The vaccenic acid unsaturation is in green. (b) Top view of CD1d with the Glc-DAG-s2 ligand in yellow (sugar removed for clarity) and the corresponding 2Fo-Fc electron density in blue, while additional, unmodeled electron density (Fo-Fc map at 3σ in green) is visible at the bottom of the A’ pocket. (c and d) Comparison of the hydrogen-bond network between CD1d and the ligands: (c) Glc-DAG-s2 yellow, α̃GalCer green, PDB code 1Z5L or (d) Glc-DAG-s2 yellow, BbGL-IIc cyan, PDB code 3ILQ. Potential hydrogen bonds shown as dashed lines, blue for Glc-DAG-s2, green for α̃GalCer or cyan for BbGL-IIc. (e and f) Top view onto the molecular surface of the CD1d binding pocket with its electrostatic potentials depicted. The Glc-DAG-s2 ligand is yellow, α̃GalCer in green (e) and BbGL-IIc in cyan (f). (g) Binding response of mouse CD1d loaded with Glc-DAG-s2 to an immobilized Vα14Vβ8.2 TCR as measured by surface plasmon resonance. Binding of increasing concentrations (0.3125-20μM) of the CD1d-DAG antigen complex is shown.

Comment in

References

    1. Taniguchi M, Harada M, Kojo S, Nakayama T, Wakao H. The regulatory role of Valpha14 NKT cells in innate and acquired immune response. Annu Rev Immunol. 2003;21:483–513. - PubMed
    1. Brigl M, Brenner MB. CD1: Antigen Presentation and T Cell Function. Annu Rev Immunol. 2004;22:817–890. - PubMed
    1. Godfrey DI, Berzins SP. Control points in NKT-cell development. Nat Rev Immunol. 2007;7:505–518. - PubMed
    1. Bendelac A, Savage PB, Teyton L. The biology of NKT cells. Annu Rev Immunol. 2007;25:297–336. - PubMed
    1. Cerundolo V, Silk JD, Masri SH, Salio M. Harnessing invariant NKT cells in vaccination strategies. Nat Rev Immunol. 2009;9:28–38. - PubMed

Publication types

Associated data