. 2012 Apr 19;31(16):2028-38.
doi: 10.1038/onc.2011.385. Epub 2011 Sep 5.

Different phenotypic consequences of simultaneous versus stepwise Apc loss

Affiliations

Different phenotypic consequences of simultaneous versus stepwise Apc loss

J M Fischer et al. Oncogene. .

Abstract

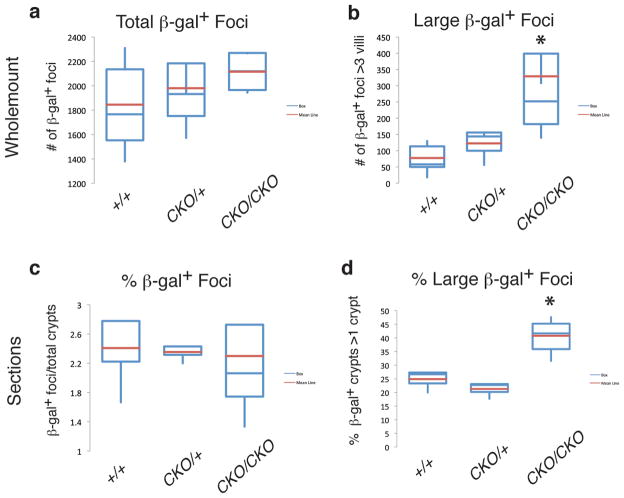
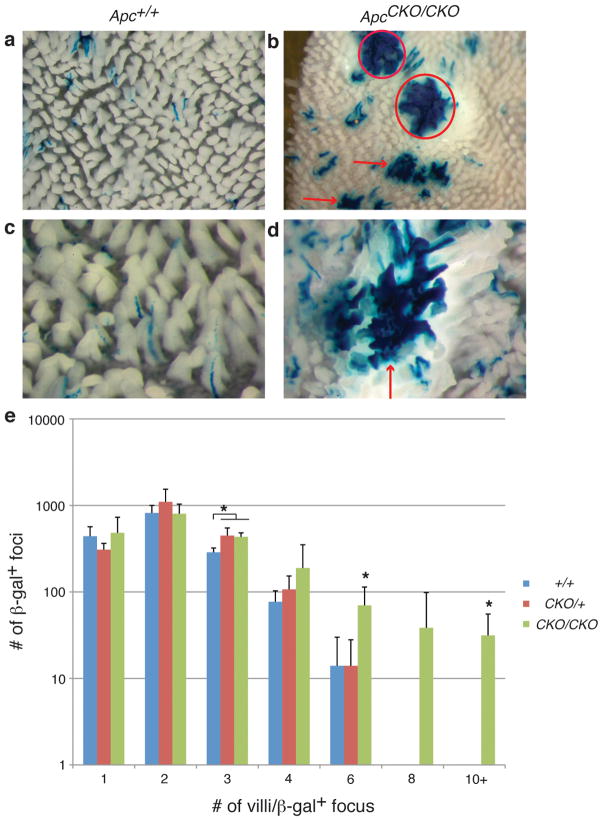
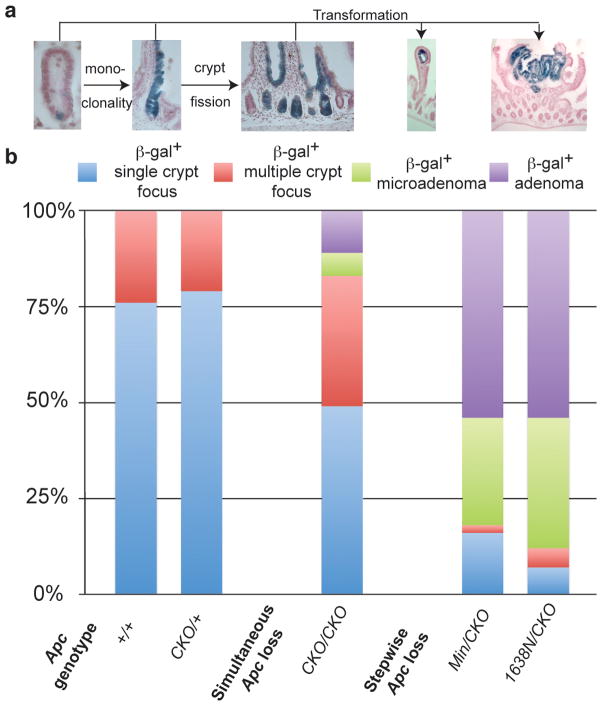
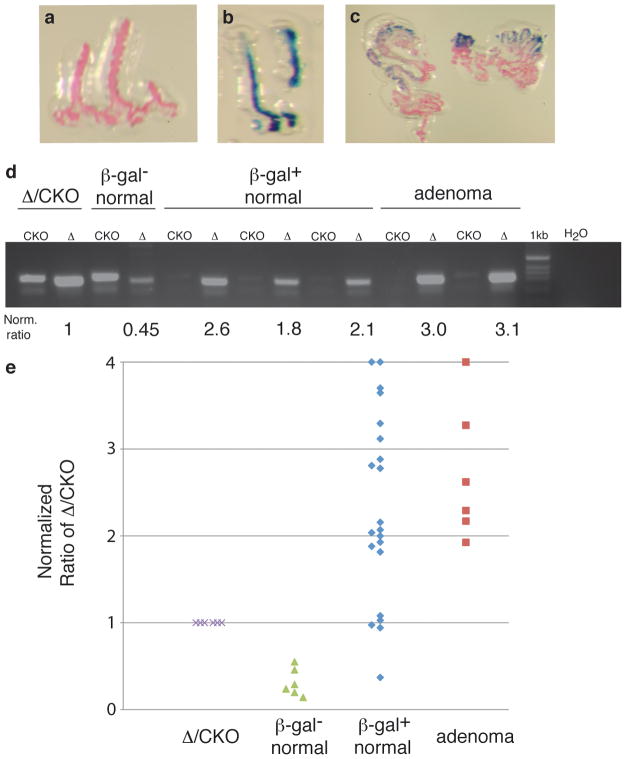
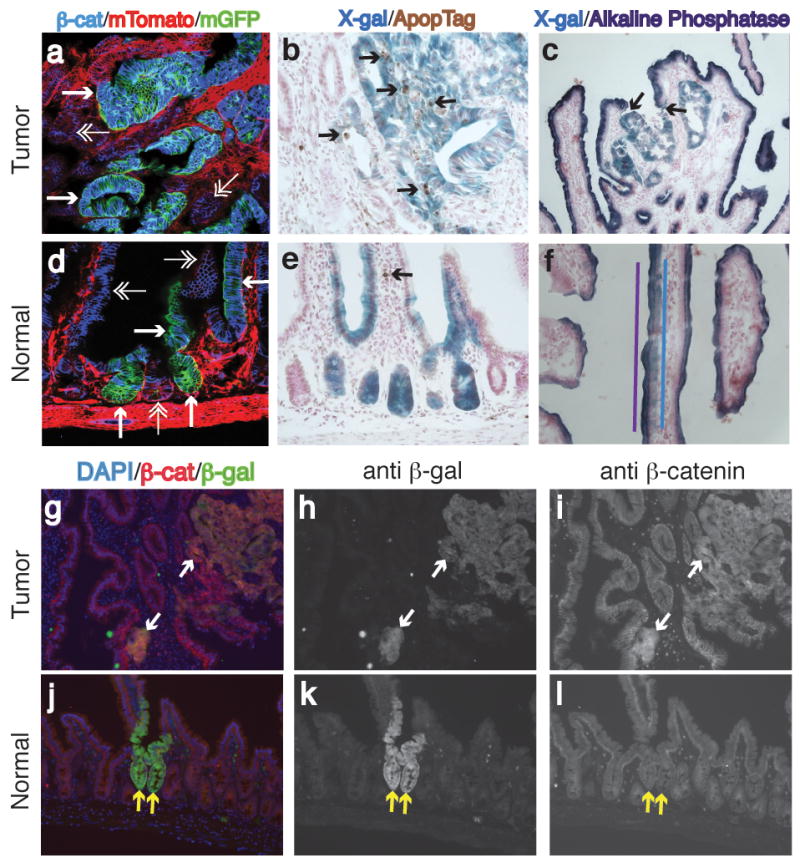
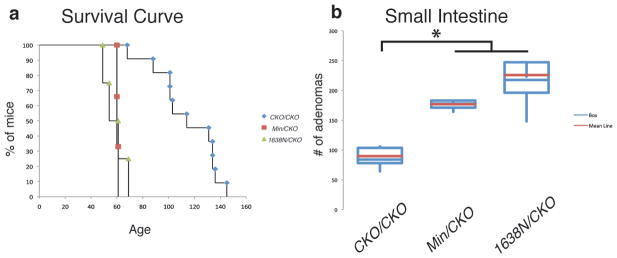
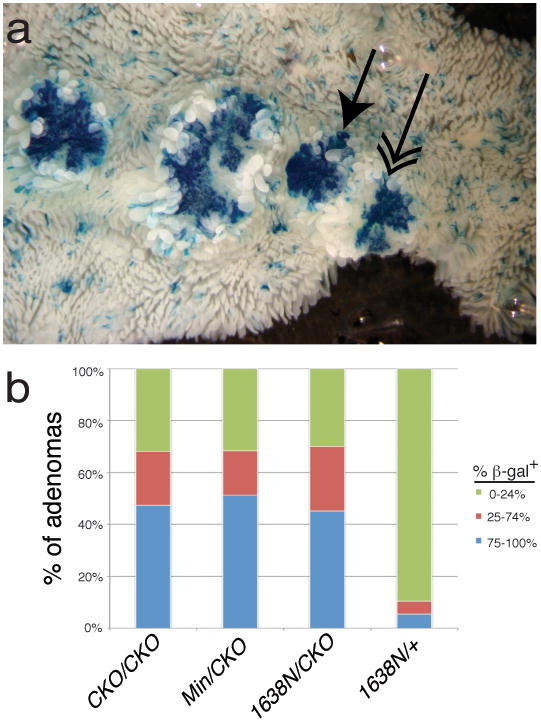
APC is considered a gatekeeper for colorectal cancer (CRC). Cells with heterozygous APC mutations have altered expression profiles suggesting that the first APC hit may help set the stage for subsequent transformation. Therefore, we measured transformation efficiency following what we have designated as 'simultaneous' versus 'stepwise' Apc loss. We combined a conditional Apc allele (Apc(CKO)) with a Cre reporter gene and an out-of-frame Cre allele (Pms2(cre)) that stochastically becomes functional by a frameshift mutation in single cells. Loss of one Apc allele (Apc(CKO/+)) had little consequence, whereas simultaneous loss of both Apc alleles (Apc(CKO/CKO)) resulted in increased clonal expansion (crypt fission), consistent with the gatekeeper function of Apc. Interestingly, our analyses showed that most of the Apc-deficient crypts in Apc(CKO/CKO) mice appeared normal, with morphological transformation, including β-catenin deregulation, occurring in only 17% of such crypts. To determine whether transformation efficiency was different following stepwise Apc loss, we combined Apc(CKO) with a germline mutant allele, either Apc(Min) or Apc(1638N). Transformation efficiency following stepwise Apc loss (Apc(Min/CKO) or Apc(1638N/CKO)) was increased five-fold and essentially all of the Apc-deficient cells were dysplastic. In summary, our data suggest that the gatekeeper function of Apc consists of two roles, clonal expansion and morphological transformation, because simultaneous Apc loss frequently leads to occult clonal expansion without morphological transformation, whereas stepwise Apc loss more often results in visible neoplasia. Finally, that Apc-deficient cells in certain scenarios can retain a normal phenotype is unexpected and may have clinical implications for surveillance strategies to prevent CRC.


Conflict of interest statement

CONFLICT OF INTEREST: The authors declare no conflicts of interest.

Figures

Figure 1
Figure 1. Increased crypt fission in ApcCKO/CKO mice
β-gal+ foci counted in whole mount (a, b), or sections of the proximal small intestine (c, d). (a) Note, there was no significant difference in the total number of β-gal+ foci between the three genotypes. (b) However, there was a significant increase in the number of “larger” β-gal+ foci, those involving more than three villi in ApcCKO/CKO mice (p=0.02). (c) In sections of the proximal small intestine, there was no significant difference in the percentage of β-gal+ foci. (d) In contrast, we did observe an increase in the percentage of β-gal+ foci involving more than one crypt in ApcCKO/CKO mice (p=0.001).
Figure 2
Figure 2. Increased number of larger β-gal+ foci in ApcCKO/CKO mice
(a–d) Whole mount images of proximal small intestine of Apc+/+ and ApcCKO/CKO mice. Adenomas denoted with circles and larger normal β-gal+ foci with arrows. (b, d) Images showing examples of larger normal β-gal+ foci in ApcCKO/CKO mice. (e) Distribution of β-gal+ foci sizes in the proximal small intestine of Apc+/+, ApcCKO/+ and ApcCKO/CKO mice. ApcCKO/+ and ApcCKO/CKO mice show a significant increase in β-gal+ foci involving 3 villi (p=0.01). ApcCKO/CKO show a significant increase in β-gal+ foci involving 6 and 10 or more villi (p=0.02 and p=0.03, respectively).
Figure 3
Figure 3. Distribution of normal and adenomatous β-gal+ foci
(a) Images of different representative β-gal+ foci illustrating a single β-gal+ cell, single β-gal+ crypt, multiple β-gal+ crypts, β-gal+ microadenoma and β-gal+ adenoma. (b) Percentage of the β-gal+ foci illustrated in (a).
Figure 4
Figure 4. Apc is efficiently recombined in Pms2cre/cre; ApcCKO/CKO mice
Images of (a) β-gal crypts, (b) β-gal+ crypts and (c) adenomas from the proximal small intestine isolated on LCM CAPs. (d) Gel of PCR reactions for the different isolated cell types. CKO is the unrecombined allele and Δ is the recombined allele. Each gel was normalized to the signal obtained from an ApcΔ/CKO sample, which has a 1:1 ratio of recombined:unrecombined ApcCKO alleles. (e) Graph of normalized recombined:unrecombined ratios that illustrates that 76% (16/21) of normal appearing β-gal+ samples had a 6–10 fold increase in the recombined:unrecombined ratio over β-gal cells (p<0.001), similar to the increase observed for the adenoma samples (p=0.85).
Figure 5
Figure 5. Characteristics of Cre-reporter+ foci
Characterization of Cre-Reporter+ tumor (a–c, g–i) and normal (d–f, j–l) tissue. (a, d) Show deregulated expression of β-catenin in GFP+ tumor tissue (single arrowheads), but normal β-catenin expression in normal GFP+ tissue (single arrowheads) (β-catenin:blue, mTomato:red[unrecombined], mGFP:green[recombined]). Double arrowheads point out unrecombined, epithelial tissue. (b, e) Show increased apoptosis in β-gal+ tumor tissue, but normal apoptosis levels in normal, β-gal+ tissue (β-gal+:blue, TUNEL:brown). Arrows denote TUNEL positive cells. (c, f) Loss of alkaline phosphatase staining in β-gal+ tumor tissue, but continued expression of alkaline phosphatase in normal, β-gal+ tissue (β-gal+:blue, alkaline phosphatase:purple). In c) arrows show demarcation of alkaline phosphatase and X-gal staining. In f) purple and blue lines illustrate the overlap of alkaline phosphatase and β-gal+ cells. (g, j) Merged images of immunofluorescence for β-catenin (red), β-gal (green) and DAPI (blue). Arrows point to the same β-gal+ regions. (h, k) Shown are images of only the β-gal (green) channel. (i, l) Images of only the β-catenin (red) channel. Note, deregulated β-catenin expression n the tumor, but normal β-catenin pattern in the normal tissue.
Figure 6
Figure 6. Increased tumor formation in ApcMin/CKO and Apc1638N/CKO mice
(a) Survival curve illustrating that ApcMin/CKO (red squares) and Apc1638N/CKO (green triangles) mice become anemic at an earlier age than ApcCKO/CKO (blue diamonds) mice (p<0.001). (b) Increased number of small intestinal adenomas in ApcMin/CKO and Apc1638N/CKO mice compared to ApcCKO/CKO mice (p=0.01).
Figure 7
Figure 7. Percentage of β-gal+ cells in proximal small intestine adenomas
(a) Whole mount image of β-gal+ adenomas in ApcCKO/CKO mice. Single-headed arrow shows a tumor scored as 100% β-gal+. Double-headed arrow shows a tumor scored as 50% β-gal+. (b) Classification of adenomas into % β-gal+ in the proximal small intestine.

References

    1. Akyol A, Hinoi T, Feng Y, Bommer GT, Glaser TM, Fearon ER. Generating somatic mosaicism with a Cre recombinase-microsatellite sequence transgene. Nat Methods. 2008;5:231–3. - PMC - PubMed
    1. Attolini CS, Cheng YK, Beroukhim R, Getz G, Abdel-Wahab O, Levine RL, et al. A mathematical framework to determine the temporal sequence of somatic genetic events in cancer. Proc Natl Acad Sci U S A. 2010;107:17604–9. - PMC - PubMed
    1. Barker N, Ridgway RA, van Es JH, van de Wetering M, Begthel H, van den Born M, et al. Crypt stem cells as the cells-of-origin of intestinal cancer. Nature. 2009;457:608–11. - PubMed
    1. Buchert M, Athineos D, Abud HE, Burke ZD, Faux MC, Samuel MS, et al. Genetic dissection of differential signaling threshold requirements for the Wnt/beta-catenin pathway in vivo. PLoS Genet. 2010;6:e1000816. - PMC - PubMed
    1. Chan MF, van Amerongen R, Nijjar T, Cuppen E, Jones PA, Laird PW. Reduced rates of gene loss, gene silencing, and gene mutation in Dnmt1-deficient embryonic stem cells. Mol Cell Biol. 2001;21:7587–600. - PMC - PubMed

Publication types