. 2012 Apr 5;31(14):1804-16.
doi: 10.1038/onc.2011.361. Epub 2011 Sep 5.

c-Abl and Arg are activated in human primary melanomas, promote melanoma cell invasion via distinct pathways, and drive metastatic progression

Affiliations

c-Abl and Arg are activated in human primary melanomas, promote melanoma cell invasion via distinct pathways, and drive metastatic progression

S S Ganguly et al. Oncogene. .

Abstract

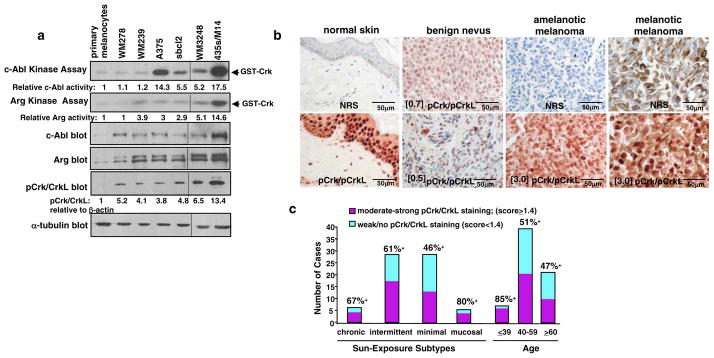
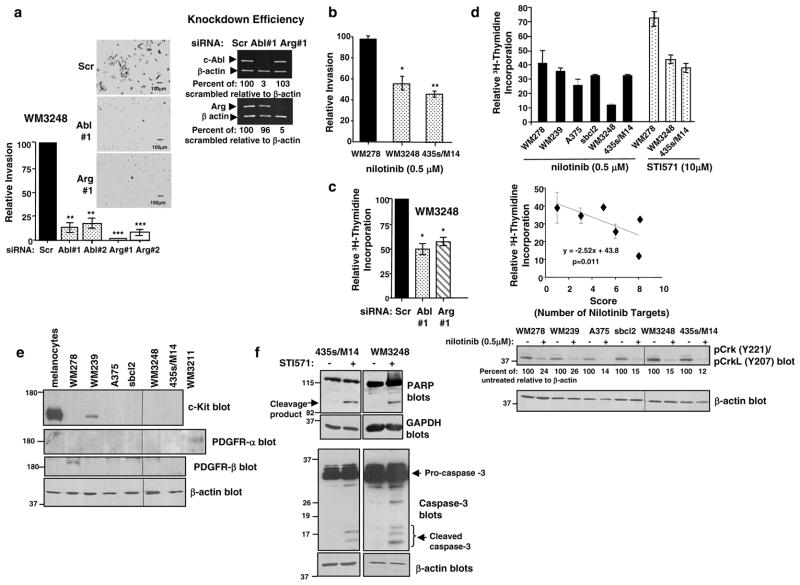
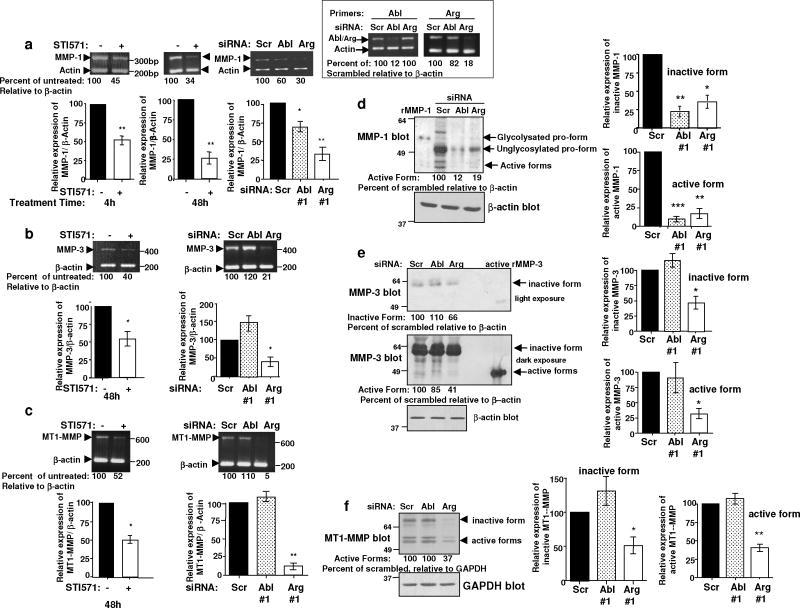
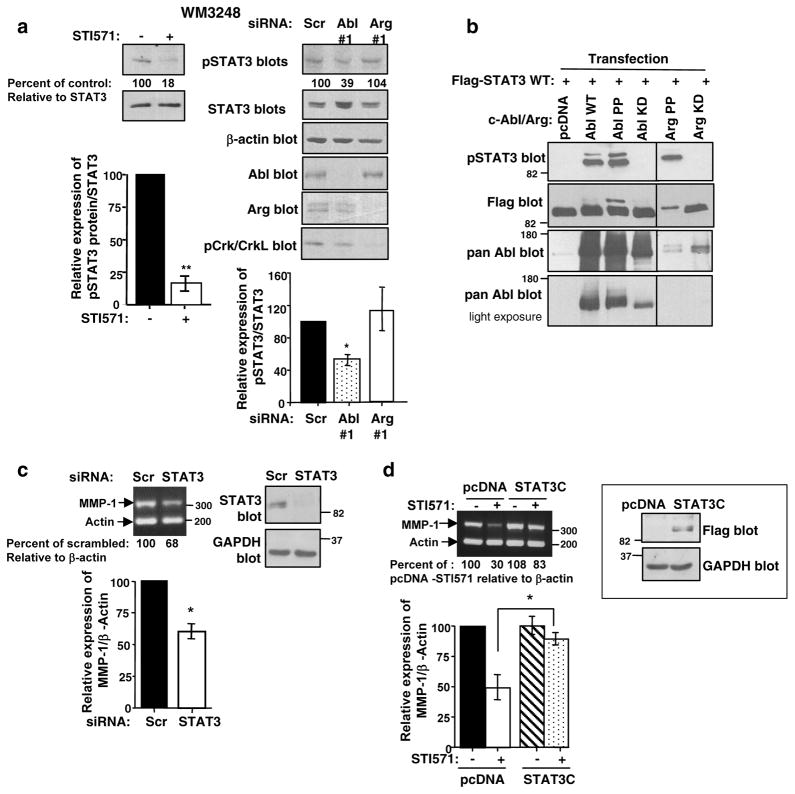
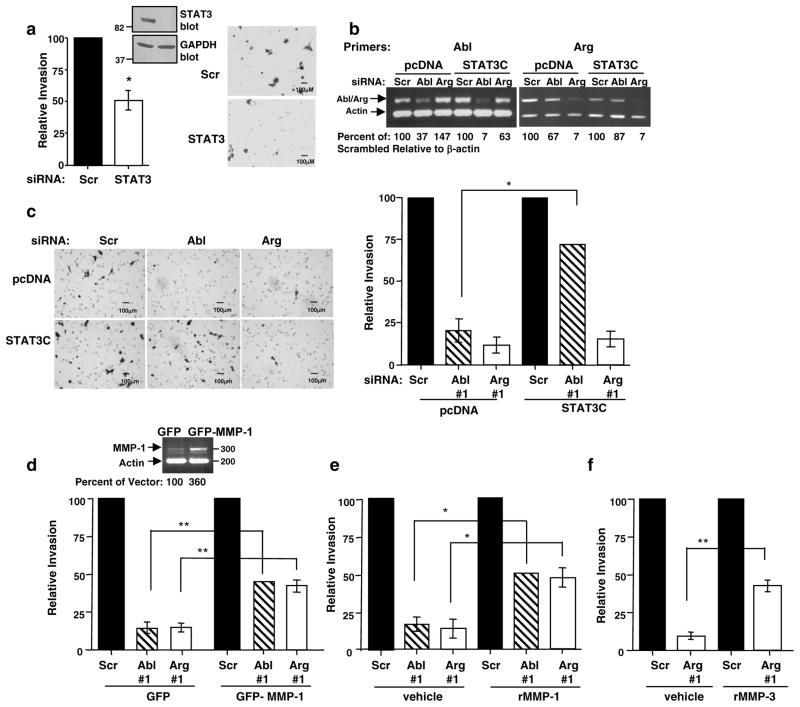
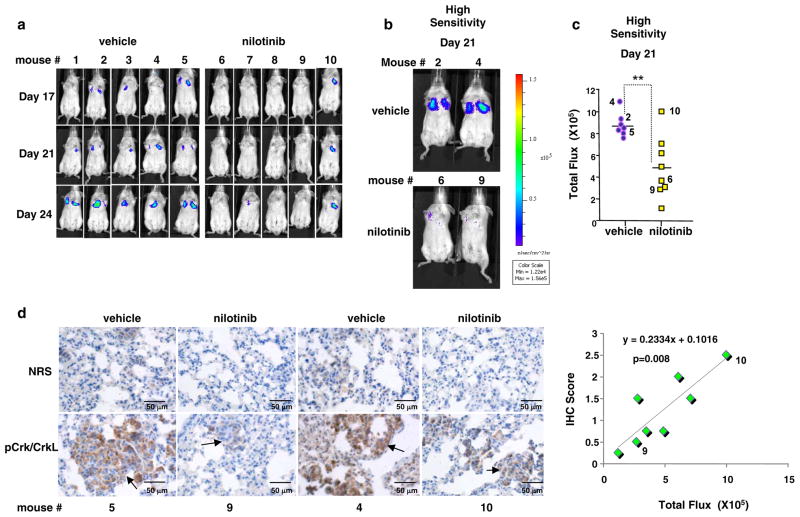
Despite 35 years of clinical trials, there is little improvement in 1-year survival rates for patients with metastatic melanoma, and the disease is essentially untreatable if not cured surgically. The paucity of chemotherapeutic agents that are effective for treating metastatic melanoma indicates a dire need to develop new therapies. Here, we found a previously unrecognized role for c-Abl and Arg in melanoma progression. We demonstrate that the kinase activities of c-Abl and Arg are elevated in primary melanomas (60%), in a subset of benign nevi (33%) and in some human melanoma cell lines. Using siRNA and pharmacological approaches, we show that c-Abl/Arg activation is functionally relevant because it is requiredfor melanoma cell proliferation, survival and invasion. Significantly, we identify the mechanism by which activated c-Abl promotes melanoma invasion by showing that it transcriptionally upregulates matrix metalloproteinase-1 (MMP-1), and using rescue approaches we demonstrate that c-Abl promotes invasion through a STAT3 → MMP-1 pathway. Additionally, we show that c-Abl and Arg are not merely redundant, as active Arg drives invasion in a STAT3-independent manner, and upregulates MMP-3 and MT1-MMP, in addition to MMP-1. Most importantly, c-Abl and Arg not only promote in vitro processes important for melanoma progression, but also promote metastasis in vivo, as inhibition of c-Abl/Arg kinase activity with the c-Abl/Arg inhibitor, nilotinib, dramatically inhibits metastasis in a mouse model. Taken together, these data identify c-Abl and Arg as critical, novel, drug targets in metastatic melanoma, and indicate that nilotinib may be useful in preventing metastasis in patients with melanomas harboring active c-Abl and Arg.


Conflict of interest statement

CONFLICTS OF INTEREST. Dr. Plattner’s work is funded by NIH/NCI. All other authors declare no potential conflicts of interest.

Figures

Figure 1
Figure 1. c-Abl and Arg are activated in human melanoma cell lines and primary melanomas
(a) Basal c-Abl and Arg kinase activities were directly assessed by in vitro kinase assay. c-Abl and Arg, immunoprecipitated from lysates from serum-starved (24h) cells, were incubated in a “hot” in vitro kinase assay using the c-Abl/Arg target, GST-tagged Crk as substrate (top 2 panels). Lysates were blotted with antibodies (bottom 2 panels). One of three representative experiments is shown. (b) Melanoma tissue microarrays were incubated with normal rabbit serum (NRS) or phospho-Crk/CrkL antibody (Y2221/Y207), hematoxylin stained, and visualized with Dako Red. Cores were scored as moderate-strongly positive if the Score was ≥1.4 where Score=Intensity (1+,2+,3+) X proportion of positive-staining tumor cells. Scores for each core are indicated in brackets (e.g. [0.5]). Photographs are 400X magnification, and two pCrk/CrkL-stained nevi are shown. (c) Graphical representation of pCrk/CrkL staining in melanoma subtypes and age groups. Positive cases have Scores ≥1.4 (see above).
Figure 2
Figure 2. Activation of c-Abl and Arg promotes invasion, proliferation, and survival of melanoma cells
(a) Serum-starved WM3248 cells, transfected with two independent cAbl or Arg siRNAs, were incubated in matrigel invasion chambers for 48h utilizing IGF-1 (10nM) as chemoattractant. The total number of invaded cells on the undersurface of the membranes were counted and expressed as a percentage of scrambled. Graphs are Mean ± SEM, n=3 independent experiments, performed in duplicate. **0.001≤p<0.01; ***p<0.001. Photographs are at 100X magnification. Knockdown of c-Abl and Arg was assessed by semi-quantitative RT-PCR (right). (b) Melanoma cells were serum-starved and treated with nilotinib (0.5μM) for 16–20h, and incubated in invasion assays as described in (a) with nilotinib in the top and bottom chambers. Graphs are Mean ± SEM, n=3, normalized to untreated. *p<0.05. (c,d) Tritiated thymidine incorporation was assessed in cells treated with STI571, nilotinib, or transfected with siRNAs. CPMs were normalized to vehicle-treated or scrambled-transfected cells. Mean ± SEM, n=3 independent experiments, performed in triplicate. Some error bars are too small to be visualized. (d, middle) The level of c-Abl/Arg activation and the number of nilotinib targets were added together to create a “Score” (Table 2, Fig. 1a, Fig. 2e), which was plotted against tritiated thymidine incorporation results. An inverse correlation between the “Score” (number of nilotinib targets) and the sensitivity to nilotinib was observed. R2=0.45, p=0.011. Lysates from untreated (e) or nilotinib-treated (24h) (d-bottom) cells in serum conditions were blotted with the indicated antibodies. (f) Lysates from detached and attached cells treated with vehicle or STI571 and deprived of serum for 72h (WM3248) or 96h (435s/M14) were probed with the indicated antibodies. Scr=scrambled.
Figure 3
Figure 3. Activated c-Abl and Arg induce MMP transcription and secretion in melanoma cells
RNA extracted from serum-starved 435s/M14 cells, treated with STI571 (10μM) for 4h (a) or 48h (a-c), or from cells transfected with Abl siRNAs and serum-starved for 48h, was subjected to semi-quantitative RT-PCR with MMP and internal control actin primers. Quantitated MMP bands were divided by quantified actin bands and expressed as a percentage of scrambled. Mean ± SEM, n≥3 independent experiments. *0.01≤p<0.05; **0.001≤p<0.01. Knockdown efficiency was determined with c-Abl/Arg primers; a representative experiment is shown (a, right inset). (d,e) Concentrated conditioned media from siRNA-transfected cells were blotted with MMP antibodies that recognize inactive and active forms. Media amounts were normalized to β-actin levels in cell lysates (below). Full-length recombinant MMP-1 (inactive and active forms) and full-length, recombinant, active MMP-3 were used to confirm the location of the active forms. Graphs are Mean ± SEM, n=3 independent experiments. *0.01≤p<0.05; **0.001≤p<0.01; ***p<0.001. (f) Lysates were blotted with antibody that recognizes active MT1-MMP (left). Graphs are Mean ± SEM, n=3 independent experiments. **0.001≤p<0.01.
Figure 4
Figure 4. c-Abl upregulates MMP-1 via STAT3
(a) WM3248 cells were treated with STI571 (10μM) for 48h or transfected with c-Abl/Arg siRNAs, and lysates probed with the indicated antibodies. Graphs are Mean ± SEM, n=3 independent experiments. *p<0.05, **0.001≤p<0.01. (b) 293T cells were cotransfected with flag-tagged STAT3 and wild-type (WT), constitutively active (PP), or kinase-dead (KD) forms of c-Abl or Arg, and lysates were blotted with the indicated antibodies. One of three representative experiments is shown. (c) RNA extracted from 435s/M14 cells, transfected with STAT3 siRNA and serum-starved (48h), was subjected to semi-quantitative RT-PCR (left). Quantitated MMP bands were divided by quantified actin bands and expressed as a percentage of scrambled. Graph is Mean ± SEM, n=3 independent experiments. *p<0.05. An aliquot of cells was lysed, and blotted with STAT3 antibody (right); a representative blot is shown. (d) Clones expressing Flag-tagged STAT3C or vector (pcDNA) were pooled, and expression examined by western blot (right). Serum-starved 435s/M14 cells, stably expressing vector or STAT3C, were treated with STI571 (10μM; 48h), and RNA subjected to semi-quantitative RT-PCR (left). Quantitated MMP bands divided by quantified actin bands were expressed as a percentage of untreated. Graph is Mean ± SEM, n=3 independent experiments. *p<0.05.
Figure 5
Figure 5. c-Abl promotes invasion in a STAT3-dependent manner
Invasion assays were performed on: (a) 435s/M14 cells transfected with scrambled or STAT3 siRNAs; (c) 435s/M14 cells stably expressing vector or STAT3C, transfected with c-Abl/Arg siRNAs; (d) 435s/M14 cells stably expressing GFP or GFP-MMP-1, transfected with c-Abl/Arg siRNAs; and (e,f) 435s/M14 cells, transfected with c-Abl or Arg siRNAs and incubated with recombinant MMP-1 or MMP-3 (25 ng/ml) during the invasion assays. Photographs are at 100X magnification. The total number of invaded cells on the undersurface of the membranes were counted and expressed as a percentage of scrambled. Graphs are Mean ± S EM, n=3 independent experiments, performed in duplicate. *0.01≤p<0.05; **0.001≤p<0.01; ***p<0.001. Some error bars are too small to be visualized. (b, d-top) Knockdown efficiency and MMP-1 expression in stably expressing cells were determined by semi-quantitative RT-PCR (35, 27 cycles, respectively); representative experiments are shown.
Figure 6
Figure 6. Activation of c-Abl and Arg promotes melanoma metastasis
435s/M14 cells, labeled with GFP and luciferase (2×10⁶), were injected into the tail vein of SCID-beige mice. Mice were treated with vehicle or nilotinib (30mg/kg; b.i.d) by oral gavage, and imaged with IVIS following luciferin D injection (i.p.). (a) IVIS imaging of representative mice on days 17, 21, and 24 post-injection. (b) Representative mice on day 21 imaged with high sensitivity (integration) such that low level fluorescence could be detected. (c) Quantitated fluorescence of all mice on day 21 imaged with high sensitivity. Each symbol indicates one animal. Numbers refer to animals numbers shown in (a, b). **0.001≤p<0.01. (d) Lungs from the indicated mice were fixed in formalin on day 24, paraffin-embedded, sectioned, stained with normal rabbit serum or antibody to phosphorylated Crk/CrkL, visualized with DAB, and hematoxylin-stained. Photographs are 400X magnification. IVIS fluorescence values were plotted against pCrk/CrkL IHC intensity scores (1–3+) in metastases from lungs of nilotinib-treated mice. A positive correlation was observed between the values (R2=0.72; p=0.008).

References

    1. Allington TM, Galliher-Beckley AJ, Schiemann WP. Activated Abl kinase inhibits oncogenic transforming growth factor-beta signaling and tumorigenesis in mammary tumors. FASEB J. 2009;23:4231–4243. - PMC - PubMed
    1. Allington TM, Schiemann WP. The Cain and Abl of Epithelial-Mesenchymal Transition and Transforming Growth Factor-beta in Mammary Epithelial Cells. Cells Tissues Organs. 2011;193:98–113. - PMC - PubMed
    1. Bachmeier BE, Albini A, Vene R, Benelli R, Noonan D, Weigert C, et al. Cell density-dependent regulation of matrix metalloproteinase and TIMP expression in differently tumorigenic breast cancer cell lines. Exp Cell Res. 2005;305:83–98. - PubMed
    1. Berwick M, Erdei E, Hay J. Melanoma epidemiology and public health. Dermatol Clin. 2009;27:205–214. viii. - PMC - PubMed
    1. Blackburn JS, Liu I, Coon CI, Brinckerhoff CE. A matrix metalloproteinase-1/protease activated receptor-1 signaling axis promotes melanoma invasion and metastasis. Oncogene. 2009;28:4237–4248. - PMC - PubMed

Publication types