. 2012 Jan 18;105(2):325-31.
doi: 10.1016/j.physbeh.2011.08.023. Epub 2011 Aug 26.

Differential effects of chow and purified diet on the consumption of sucrose solution and lard and the development of obesity

Affiliations

Differential effects of chow and purified diet on the consumption of sucrose solution and lard and the development of obesity

John W Apolzan et al. Physiol Behav. .

Abstract

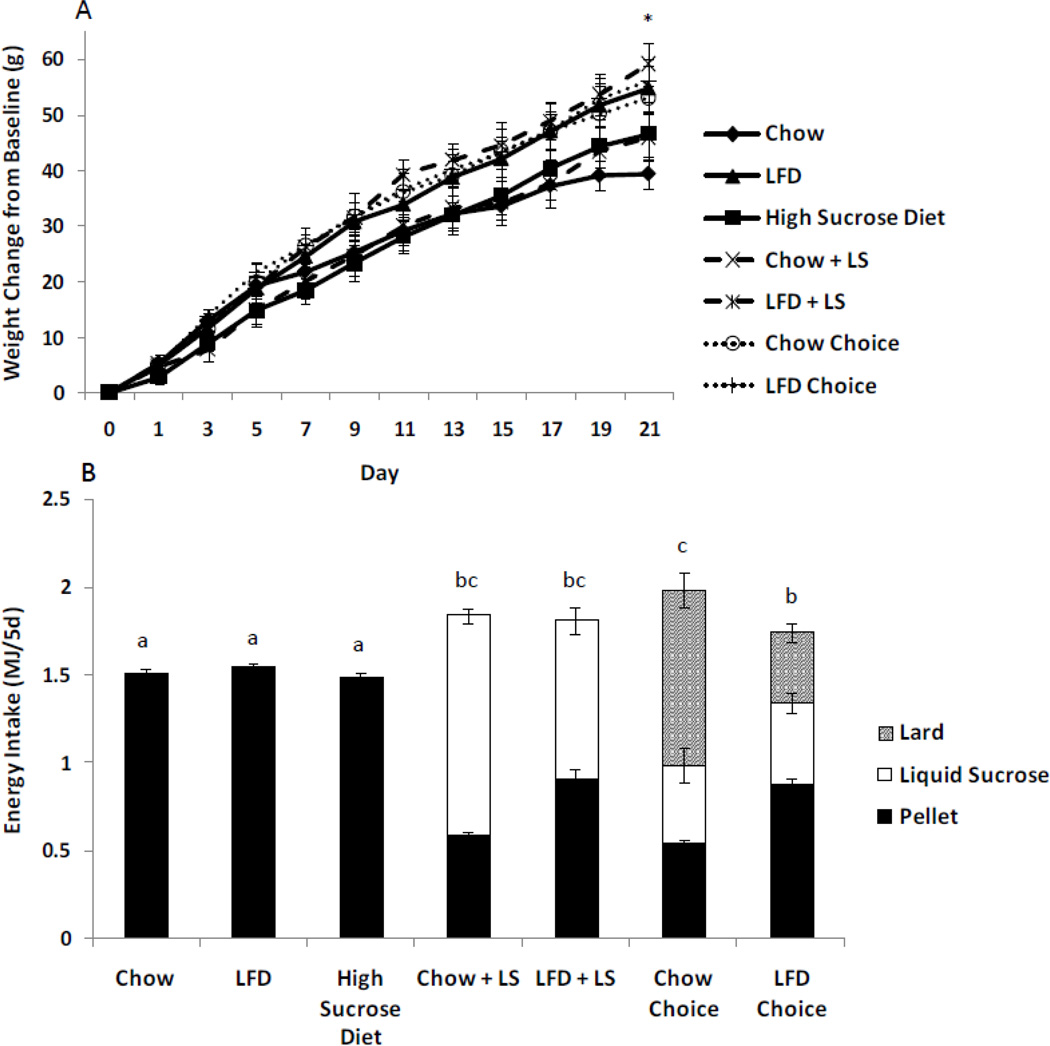
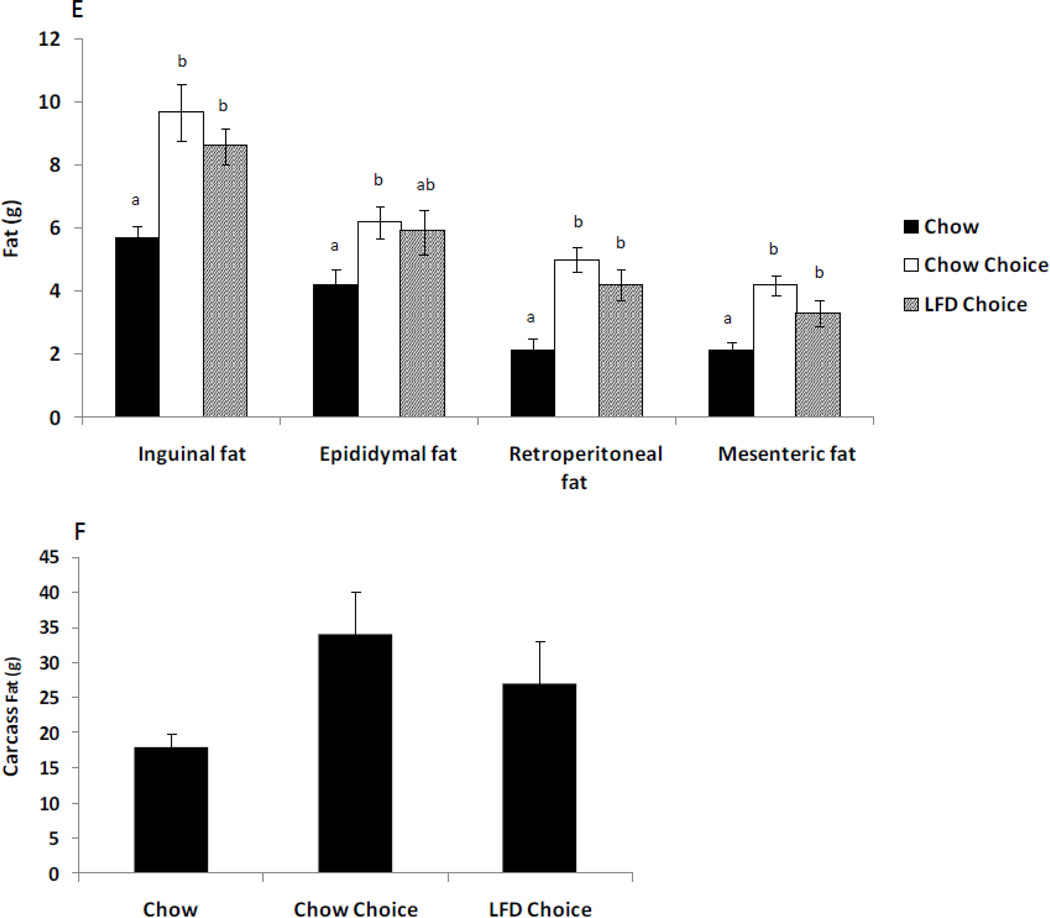
Obesity has been associated with increased consumption of sweetened beverages and a high-fat diet. We determined whether the composition of the dry pellet offered with liquid sucrose (LS) and lard influenced the development of obesity. We hypothesized that animals offered LS or LS and lard (choice), in addition to chow or purified low fat diet pellet (LFD; 10% fat), would gain more body fat than controls. We compared the effects of LFD vs. chow on voluntary consumption of LS and lard, serum triglyceride (TG), glucose, and body fat over 21 days. Male Sprague Dawley rats (n=10/group) were offered chow, chow+LS, chow choice, LFD, LFD+LS, LFD choice or solid high-sucrose diet (70% sucrose). Energy intakes of rats fed chow, LFD, and high-sucrose diets were similar. Energy intake was increased by 16% in chow+LS, 15% in LFD+LS, 11% in LFD choice, and 23% in chow choice rats. Chow choice rats consumed 142% more lard than LFD choice rats. Fasting glucose increased in all choice rats compared with the chow and high-sucrose diet rats. Fasting TG increased in LFD choice rats and were ~75% higher than those of chow, LFD, or high-sucrose rats. Chow choice had higher carcass fat than chow, chow+LS, and LFD groups however LFD choice was not different from their controls. Another experiment confirmed rats consumed 158% more lard when given chow choice compared to LFD choice. The diet offered to rats with free access to LS and lard influenced the development of obesity, sucrose and lard selection, and TG.


Conflict of interest statement

Disclosures:

The authors declare no conflict of interest.

Figures

Figure 1
Figure 1. Rats consuming chow, LFD, high sucrose diet, chow + liquid sucrose, LFD + liquid sucrose, chow choice, or LD choice in experiment 1
(A) Weight gain from baseline of rats in experiment 1. Data are mean ± SEM for groups of 9 or 10 rats. Baseline weight was body weight on day 0 of experiment measured before the rats were offered experimental diets. An asterisk indicates significant difference between the LFD + LS and LFD choice groups compared to the chow group. Baseline weight was body weight on day 0 of experiment measured before the rats were offered experimental diets. (B) Energy intakes of rats in experiment 1. Data are mean ± SEM for groups of 9 or 10 rats. Letters with a different superscript are different at p<0.05. (C) Blood glucose concentration during an insulin tolerance test performed on day 19 of experiment 1. Data are mean ± SEM for groups of 9 or 10 rats. (D) Inguinal, epididymal, retroperitoneal, and mesenteric fat pad weights of rats in experiment 1. Data are mean ± SEM for groups of 9 or 10 rats. Letters with a different superscript are different at p<0.05. (E) Carcass body fat content of rats in experiment 1. Data are mean ± SEM for groups of 9 or 10 rats. Letters with a different superscript are different at p<0.05.
Figure 2
Figure 2. Rats consuming chow, chow choice, or LFD choice in experiment 2
(A) Day 1–31 energy intakes of rats in experiment 2. Data are mean ± SEM for groups of 6 and 14 rats. Letters with a different superscript are different at p<0.05. (B) Day 32–62 energy intakes of rats in experiment 2. Data are mean ± SEM for groups of 6 or 7 rats. Letters with a different superscript are different at p<0.05. (C) Weight gain from baseline of rats in experiment 2. Data are mean ± SEM for groups of 6 or 7 rats. Baseline weight was body weight on day 0 of experiment measured before the rats were offered experimental diets. An asterisk indicates significant difference between the choice groups compared to the chow group. Baseline weight was body weight on day 0 of experiment measured before the rats were offered experimental diets. (D) Blood glucose concentration during an insulin tolerance test performed on day 58 of experiment 2. Data are mean ± SEM for groups of 6 or 7 rats. (E) Inguinal, epididymal, retroperitoneal, and mesenteric fat pad weights of rats in experiment 2. Data are mean ± SEM for groups of 6 or 7 rats. Letters with a different superscript are different at p<0.05. (F) Carcass body fat content of rats in experiment 2. Data are mean ± SEM for groups of 6 or 7 rats.

References

    1. Young GS, Kirkland JB. Rat models of caloric intake and activity: relationships to animal physiology and human health. Applied physiology, nutrition, and metabolism. 2007;32:161–176. - PubMed
    1. Butler AA, Kozak LP. A recurring problem with the analysis of energy expenditure in genetic models expressing lean and obese phenotypes. Diabetes. 2010;59:323–329. - PMC - PubMed
    1. Munzberg H. Leptin-signaling pathways and leptin resistance. Forum Nutr. 2010;63:123–132. - PMC - PubMed
    1. Myers MG, Cowley MA, Munzberg H. Mechanisms of leptin action and leptin resistance. Annual review of physiology. 2008;70:537–556. - PubMed
    1. Buettner R, Scholmerich J, Bollheimer LC. High-fat diets: modeling the metabolic disorders of human obesity in rodents. Obesity (Silver Spring) 2007;15:798–808. - PubMed

Publication types