

Towards a model-based integration of co-registered electroencephalography/functional magnetic resonance imaging data with realistic neural population meshes
- PMID: 21893528
- PMCID: PMC3263777
- DOI: 10.1098/rsta.2011.0080
Towards a model-based integration of co-registered electroencephalography/functional magnetic resonance imaging data with realistic neural population meshes
Abstract
Brain activity can be measured with several non-invasive neuroimaging modalities, but each modality has inherent limitations with respect to resolution, contrast and interpretability. It is hoped that multimodal integration will address these limitations by using the complementary features of already available data. However, purely statistical integration can prove problematic owing to the disparate signal sources. As an alternative, we propose here an advanced neural population model implemented on an anatomically sound cortical mesh with freely adjustable connectivity, which features proper signal expression through a realistic head model for the electroencephalogram (EEG), as well as a haemodynamic model for functional magnetic resonance imaging based on blood oxygen level dependent contrast (fMRI BOLD). It hence allows simultaneous and realistic predictions of EEG and fMRI BOLD from the same underlying model of neural activity. As proof of principle, we investigate here the influence on simulated brain activity of strengthening visual connectivity. In the future we plan to fit multimodal data with this neural population model. This promises novel, model-based insights into the brain's activity in sleep, rest and task conditions.
Figures
 ,
,  ,
,  and
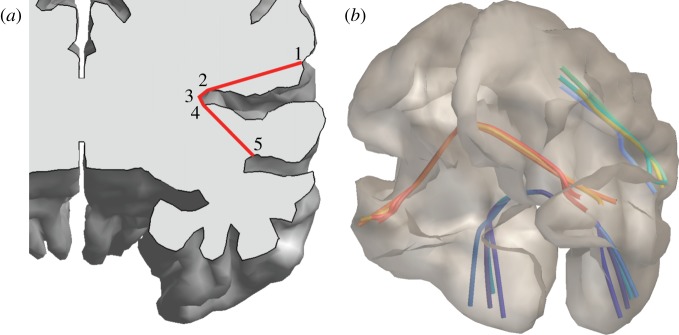
and  within the cortical volume are concatenated to the shortest route
  . (b) Examples of shortest routes so determined.
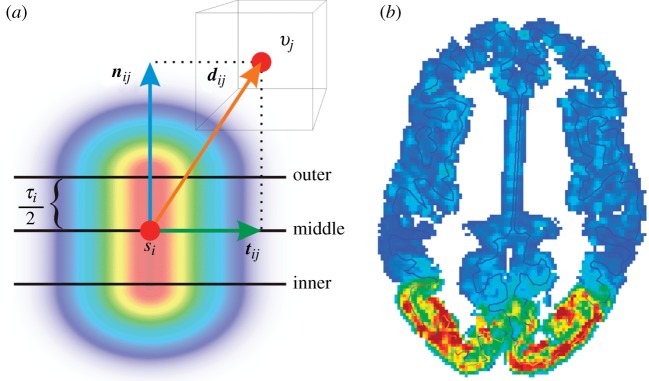
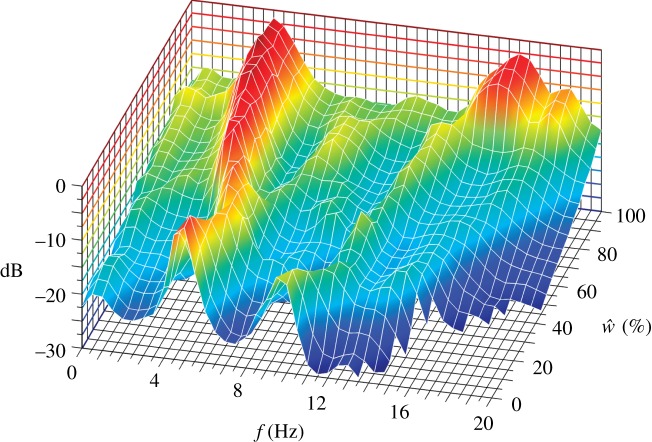
 . The power is shown in dB relative to the largest overall value.
References
-
- Berger H.1929Über das Elektrenkephalogramm des Menschen Arch. Psychiatr. Nervenkr. 87527–570.10.1007/BF01797193 (doi:10.1007/BF01797193) - DOI - DOI
-
- Niedermeyer E., Lopes da Silva F. H., editors. Electroencephalography: basic principles, clinical applications, and related fields. 5th edn. Philadelphia, PA: Lippincott Williams & Wilkins; 2005.
-
- Norris D. G.2006Principles of magnetic resonance assessment of brain function J. Magn. Reson. Imag. 23794–807.10.1002/jmri.20587 (doi:10.1002/jmri.20587) - DOI - DOI - PubMed
-
- Matthews P. M., Honey G. D., Bullmore E. T.2006Applications of fMRI in translational medicine and clinical practice Nat. Rev. Neurosci. 7732–744.10.1038/nrn1929 (doi:10.1038/nrn1929) - DOI - DOI - PubMed
-
- Stufflebeam S. M., Rosen B. R.2007Mapping cognitive function Neuroimag. Clin. N. Am. 17469–484.10.1016/j.nic.2007.07.005 (doi:10.1016/j.nic.2007.07.005) - DOI - DOI - PMC - PubMed
MeSH terms
Substances
LinkOut - more resources
Full Text Sources
Other Literature Sources
Medical
Research Materials