. 2012 Jul;90(6):620-9.
doi: 10.1038/icb.2011.76. Epub 2011 Sep 6.

Blk haploinsufficiency impairs the development, but enhances the functional responses, of MZ B cells

Affiliations

Blk haploinsufficiency impairs the development, but enhances the functional responses, of MZ B cells

Elizabeth M Samuelson et al. Immunol Cell Biol. 2012 Jul.

Abstract

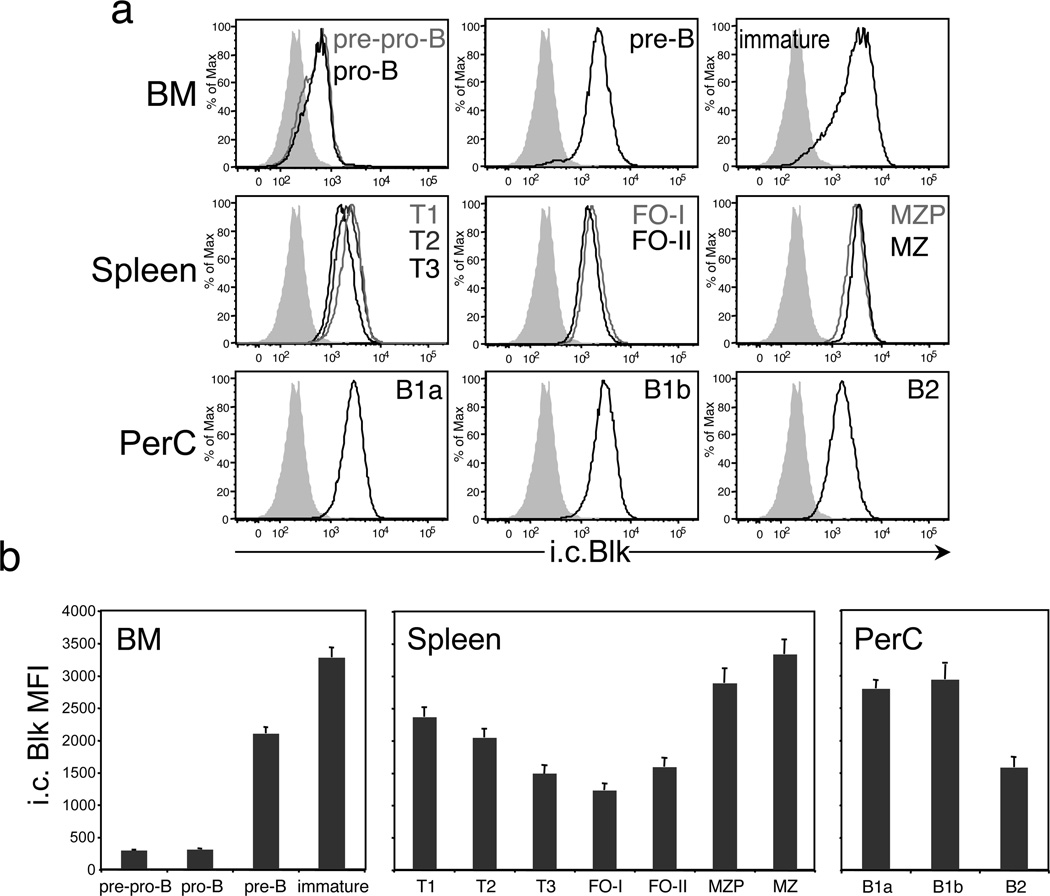
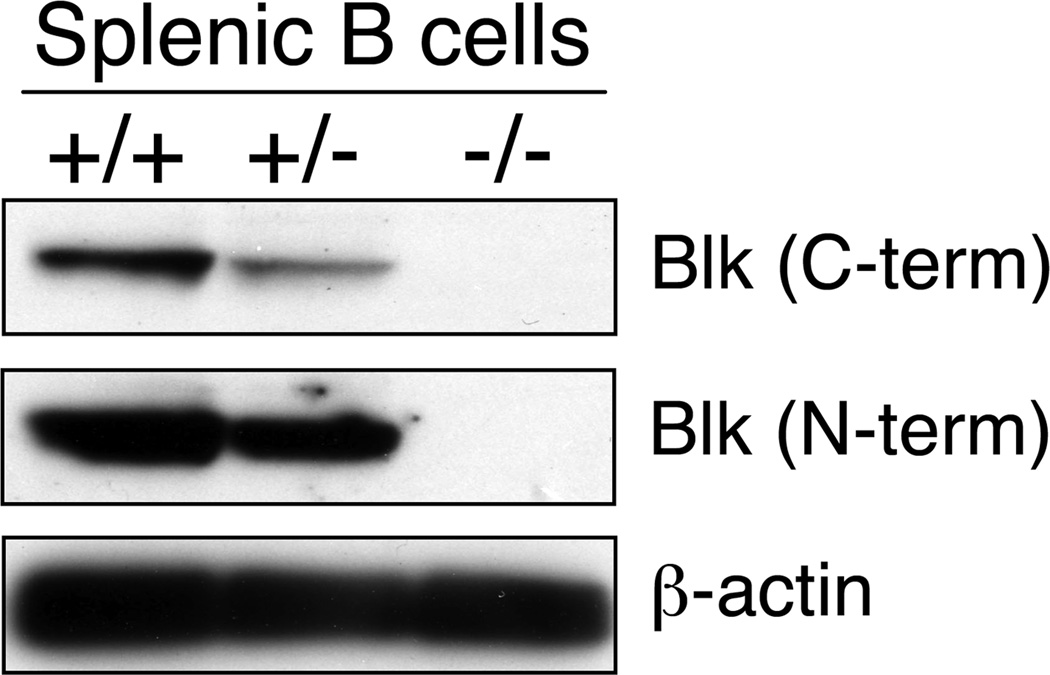
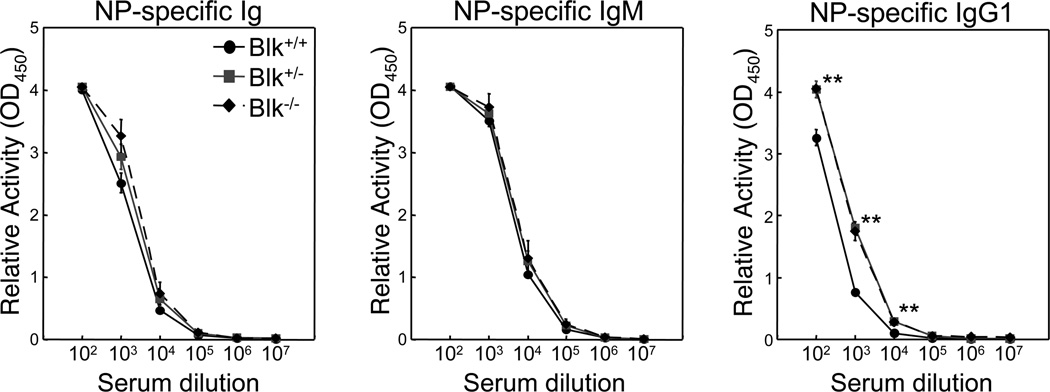
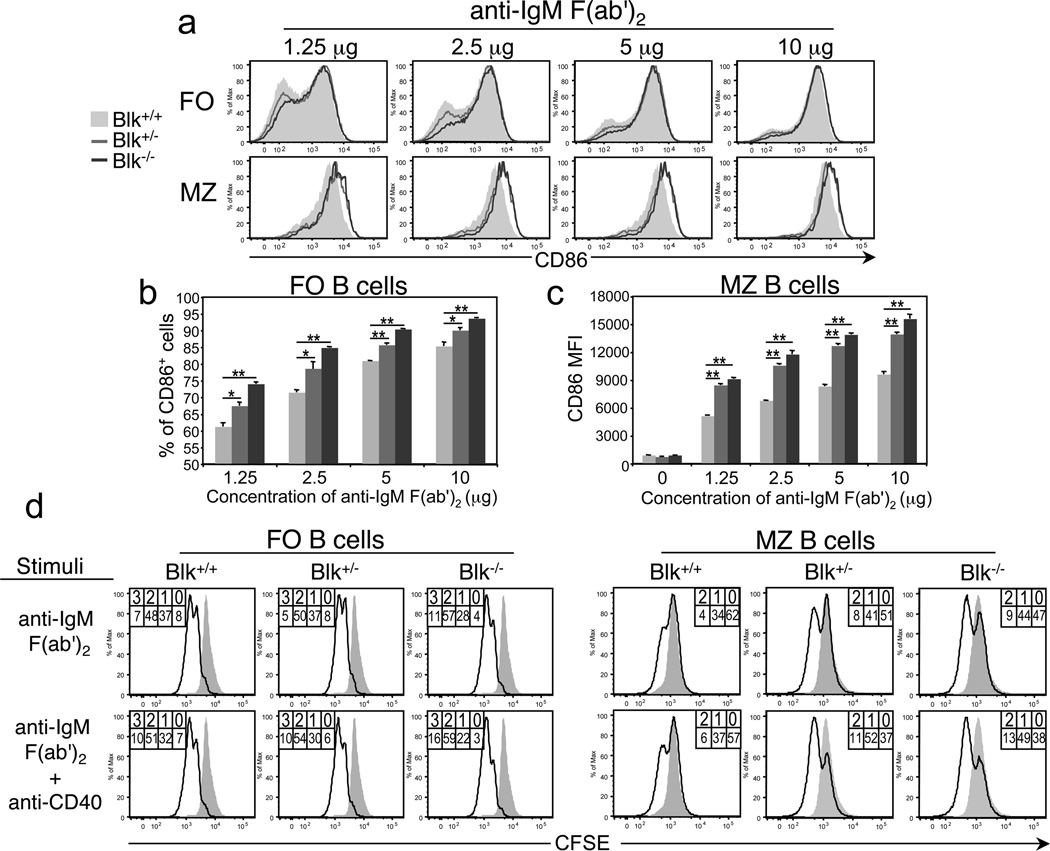
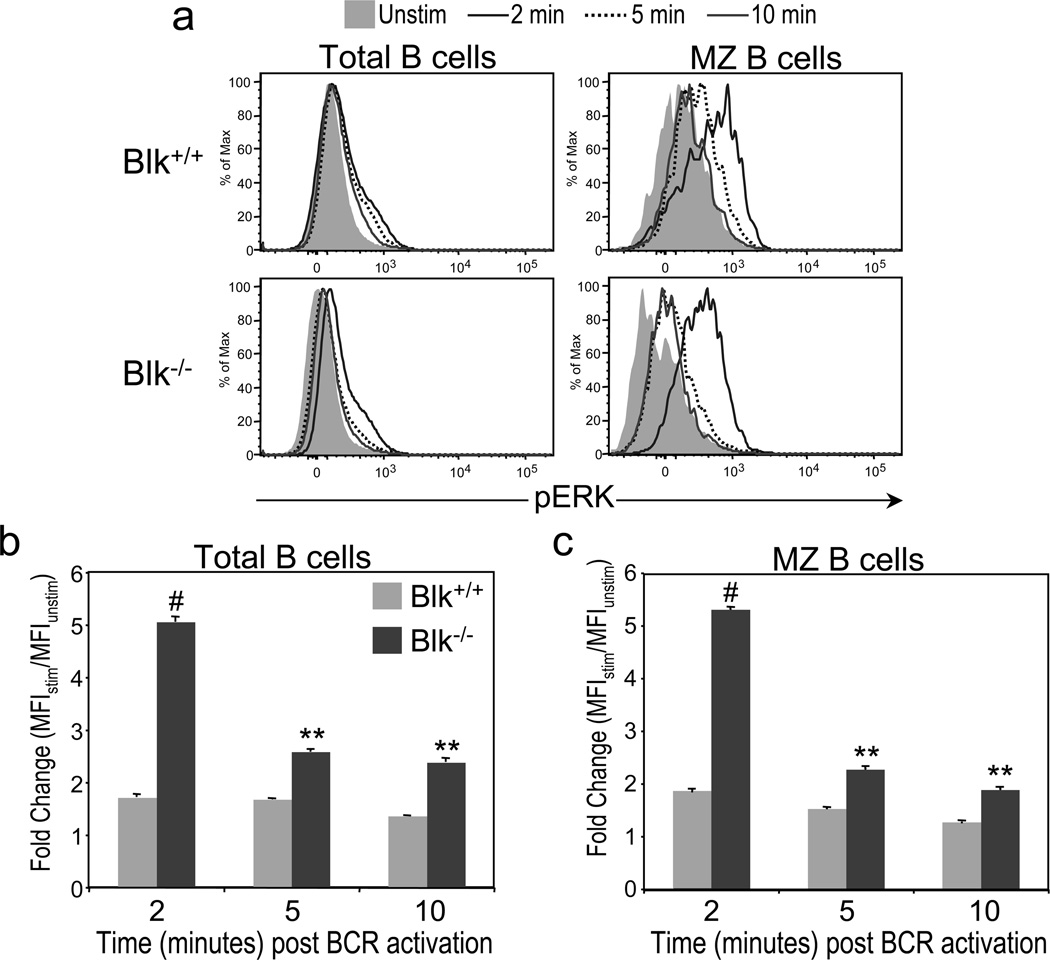
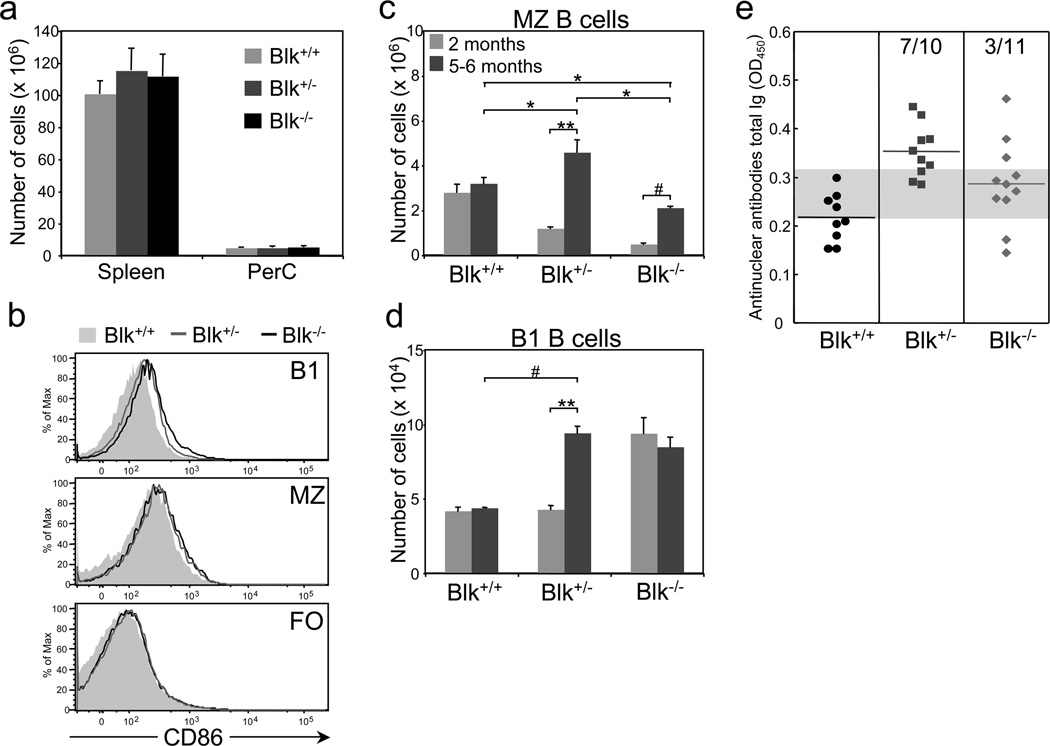
Blk was identified two decades ago as a B-cell-specific member of the Src family of tyrosine kinases. Recent studies, however, have discovered that Blk is expressed in many cell types outside of the B lineage, including early thymic precursors, interleukin-17-producing γδ T cells and pancreatic β-cells. In light of these recent discoveries, we performed a more comprehensive analysis of Blk expression patterns in hematopoietic cells and found that Blk is differentially expressed in mature B-cell subsets, with marginal zone (MZ) B cells expressing high levels, B1 B cells expressing intermediate-to-high levels and follicular (FO) B cells expressing low levels of Blk. To determine whether these differences in Blk expression levels reflected differential requirements for Blk in MZ, B1 and FO B-cell development, we analyzed the effects of reducing and eliminating Blk expression on B-cell development. We report that both Blk haploinsufficiency and Blk deficiency impaired the generation of MZ B cells. Moreover, although there were fewer MZ B cells in Blk(+/-) and Blk(-/-) mice as compared with Blk(+/+) mice, Blk-mutant MZ B cells were hyper-responsive to B-cell receptor stimulation, both in vitro and in vivo. Thus, this study has revealed a previously unappreciated role for Blk in the development and activation of MZ B cells.


Figures

Figure 1
Figure 1
Blk is differentially expressed in immature and mature B cell subsets. (a) Histograms show representative staining of the i.c. levels of Blk in gated populations of immature and mature B cell subsets in the BM, spleen and PerC of C57BL/6 mice. In the BM, these subsets include pre-pro-B (IgM B220+ CD43+ c-Kitlo), pro-B (IgM B220+ CD43+ c-Kit), pre-B (IgM B220+ CD43), and immature (IgM+ B220lo) B cells. In the spleen, the subsets include T1 (B220+ CD93+ IgMhi CD23), T2 (B220+ CD93+ IgMhi CD23+), T3 (B220+ CD93+ IgMlo CD23+), FO-I (CD19+ IgDhi IgMlo CD21+), FO-II (CD19+ IgDhi IgMhi CD21+), MZP (CD19+ IgDhi IgMhi CD21hi), and MZ (CD19+ IgDlo IgMhi CD21hi) B cells. In the PerC, the subsets include B1a (IgM+ CD5lo CD11b+), B1b (IgM+ CD5 CD11b+) and B2 (IgM+ CD5 CD11b) B cells. Cells from all tissues were stained and acquired on the same day. Data are representative of two independent experiments, with 3 mice per experiment. Solid gray histograms represent Blk staining levels in mature CD4+ T cells, which express negligible levels of Blk by real-time RT-PCR analysis. (b) Summary of the data presented in a. Comparison of i.c. Blk levels, presented as mean fluorescence intensity values, in gated immature and mature B cell subsets.
Figure 2
Figure 2
Comparison of Blk Expression Levels in B cells from Blk+/+, Blk+/− and Blk−/− mice. Western blot analysis of B cell lysates from Blk+/+, Blk+/− and Blk−/− mice (50 µg of protein/lane). Blots were probed with two different anti-Blk antibodies. Densitometric analysis of the bands shows a ~45% decrease in Blk levels in Blk+/− B cells compared to Blk+/+ B cells. Data are representative of three independent experiments.
Figure 3
Figure 3
Effects of Blk-haploinsufficiency and -deficiency on B cell development in the spleen and peritoneal cavity. (a) Phenotypic analysis of splenocytes from age-matched Blk+/+, Blk+/− and Blk−/− mice. Left panel, dot plots show representative CD93 versus B220 staining profiles on total splenocytes. The percentages of immature transitional B cells (CD93+ B220+) and mature B cells (CD93 B220+) are shown. Middle panels, dot plots show representative IgM versus CD23 staining profiles on gated immature transitional and mature B cell subsets. The percentages of T1, T2, T3 and FO-I B cells are shown. Right panel, dot plots show representative CD21 versus CD1d staining profiles on gated CD23 IgMhi B cells. The percentage of MZ B cells (CD21hi CD1d+) is shown. (b) Dot plots show representative IgD versus IgM staining profiles on total splenocytes. The percentage of IgDhi IgMhi B cells is shown. Adjacent histograms show CD21 surface levels on gated IgDhi IgMhi B cells. The percentages of FO-II B cells (CD21+ IgDhi IgMhi) and MZP cells (CD21hi IgDhi IgMhi) are shown. Data are representative of 4 to 6 mice per genotype. (c) Dot plots show representative CD11b versus CD5 staining on IgM+ PerC cells within the lymphoid gate. The percentages of B1a (CD11b+ CD5+ IgM+) and B1b (CD11b+ CD5 IgM+) cells are shown. Data are representative of 3 to 5 mice per genotype.
Figure 4
Figure 4
Effects of Blk-haploinsufficiency and -deficiency on the humoral responses to a T-independent antigen. Age-matched Blk+/+, Blk+/− and Blk−/− mice were immunized intravenously with NP-Ficoll, a type 2 T-independent antigen. 7 days later, sera were collected and analyzed. Relative amounts of NP-specific serum Ig, IgM and IgG1 in immunized Blk+/+, Blk+/− and Blk−/− mice. **p ≤ 0.01. Data represent 3 to 4 mice per genotype.
Figure 5
Figure 5
Effects of Blk-haploinsufficiency and -deficiency on B cell activation in vitro. (a) Upregulation of CD86 expression following BCR stimulation. Splenocytes from Blk+/+, Blk+/− and Blk−/− mice were plated and then stimulated with varying doses (1.25, 2.5, 5, and 10 µg/ml) of goat anti-mouse F(ab')2 anti-IgM for 24 hours. Histograms show CD86 expression on gated MZ (CD21hi CD1d+ IgDlo) and FO (CD23+ IgDhi) B cells from Blk+/+ (shaded histogram), Blk+/− (gray histogram) and Blk−/− (dark gray histogram) mice. Data are representative of three independent experiments. (b) Summary of FO B cell data presented in a. Comparison of the percentages of CD86+ FO B cells among Blk+/+ (light gray bars), Blk+/− (gray bars) and Blk−/− (dark gray bars) mice as a function of antigen dose. *p ≤ 0.05, **p ≤ 0.01. (c) Summary of MZ B cell data presented in a. Comparison of the mean fluorescence intensity of CD86 on MZ B cells from Blk+/+ (light gray bars), Blk+/− (gray bars) and Blk−/− (dark gray bars) mice as a function of antigen dose. **p ≤ 0.01. (d) Comparison of proliferative responses following BCR stimulation. Purified splenic B cells were labeled with CFSE and then stimulated with soluble anti-IgM (Fab’)2 (10 µg/ml) or with soluble anti-IgM (Fab’)2 (10 µg/ml) and anti-CD40 monoclonal antibody (1 µg/ml). After 72 hours, cells were harvested, stained with monoclonal antibodies against various surface antigens to identify and gate FO and MZ B cells subsets, and then proliferation was assessed by flow cytometric analysis. The percentage of cells within each CFSE peak is given. The overlay histograms show representative CFSE levels in unstimulated B cells. Data are representative of two independent experiments, with 4 mice per genotype.
Figure 6
Figure 6
Effects of Blk-deficiency on BCR signal transduction. Splenocytes from Blk+/+ and Blk−/− mice were stimulated for 0, 2, 5 and 10 minutes with 10 µg/ml of goat anti-mouse F(ab')2 anti-IgM, stained with monoclonal antibodies against various surface antigens in addition to anti-pERK, and then analyzed by flow cytometric analysis. (a) Sample histograms for intracellular pERK in unstimulated (shaded histogram) and stimulated total B cells (left panel) and MZ B cells (right panel) from Blk+/+ (top panel) and Blk−/− (bottom panel) mice. Comparison of the kinetics and magnitude of ERK activation in B cells (b) and MZ B cells (c) from Blk+/+ and Blk−/− mice. Data are presented as fold change, which was calculated by dividing the geometric mean fluorescence intensity (MFI) of the stimulated sample (MFIstim) by the MFI of the unstimulated sample (MFIunstim). **p ≤ 0.01, #p ≤ 0.001. Data are representative of three independent experiments.
Figure 7
Figure 7
Aged Blk+/− and Blk−/− mice display autoimmune phenotypes. (a) Comparison of the absolute numbers of splenocytes and PerC cells in 5 to 6-month old Blk+/+, Blk+/− and Blk−/− mice. Data represent 3 to 6 mice per genotype. (b) Comparison of the surface levels of CD86 on B1, MZ and FO B cells from aged Blk+/+, Blk+/− and Blk−/− mice. Data are representative of 3 to 6 mice per genotype. Comparison of the number of MZ (c) and B1 (d) B cells in young (2 months of age) and aged (5 to 6 months of age) Blk+/+, Blk+/− and Blk−/− mice. *p ≤ 0.05, **p ≤ 0.01, #p ≤ 0.001. Data are representative of 3 to 6 mice per genotype. (e) Sera were collected from 6-month-old Blk+/+, Blk+/− and Blk+/− mice and analyzed for the presence of ANA by ELISA. Data are presented as OD450 readings for a 1:100 dilution of serum. Symbols represent individual mice. Gray horizontal bar marks the upper limit (Blk+/+ mean plus 2 standard deviations) of the normal range. Numbers of Blk+/− and Blk−/− mice that exhibit serum ANA levels above the upper limit of the normal range are shown.

References

    1. Lowell CA. Src-family kinases: Rheostats of immune cell signaling. Mol. Immunol. 2004;41:631–643. - PubMed
    1. Palacios EH, Weiss A. Function of the Src-family kinases, lck and fyn, in T cell development and activation. Oncogene. 2004;23:7990–8000. - PubMed
    1. Dymecki SM, Niederhuber JE, Desiderio SV. Specific expression of a tyrosine kinase gene, blk, in B lymphoid cells. Science. 1990;247:332–336. - PubMed
    1. Molina TJ, Kishihara K, Siderovski DP, van Ewijk W, Narendran A, Timms E, Wakeham A, Paige CJ, Hartmann KU, Veillette A, et al. Profound block in thymocyte development in mice lacking p56lck. Nature. 1992;357:161–164. - PubMed
    1. Texido G, Su IH, Mecklenbräuker I, Saijo K, Malek SN, Desiderio S, Rajewsky K, Tarakhovsky A. The B-cell-specific Src-family kinase Blk is dispensable for B-cell development and activation. Mol. Cell. Biol. 2000;20:1227–1233. - PMC - PubMed

Publication types

Substances