. 2011 Oct 18;50(41):8792-803.
doi: 10.1021/bi200971x. Epub 2011 Sep 22.

Molecular origin of electron paramagnetic resonance line shapes on β-barrel membrane proteins: the local solvation environment modulates spin-label configuration

Affiliations

Molecular origin of electron paramagnetic resonance line shapes on β-barrel membrane proteins: the local solvation environment modulates spin-label configuration

Daniel M Freed et al. Biochemistry. .

Abstract

In this work, electron paramagnetic resonance (EPR) spectroscopy and X-ray crystallography were used to examine the origins of EPR line shapes from spin-labels at the protein-lipid interface on the β-barrel membrane protein BtuB. Two atomic-resolution structures were obtained for the methanethiosulfonate spin-label derivatized to cysteines on the membrane-facing surface of BtuB. At one of these sites, position 156, the label side chain resides in a pocket formed by neighboring residues; however, it extends from the protein surface and yields a single-component EPR spectrum in the crystal that results primarily from fast rotation about the fourth and fifth bonds linking the spin-label to the protein backbone. In lipid bilayers, site 156 yields a multicomponent spectrum resulting from different rotameric states of the labeled side chain. Moreover, changes in the lipid environment, such as variations in bilayer thickness, modulate the EPR spectrum by modulating label rotamer populations. At a second site, position 371, the labeled side chain interacts with a pocket on the protein surface, leading to a highly immobilized single-component EPR spectrum that is not sensitive to hydrocarbon thickness. This spectrum is similar to that seen at other sites that are deep in the hydrocarbon, such as position 170. This work indicates that the rotameric states of spin-labels on exposed hydrocarbon sites are sensitive to the environment at the protein-hydrocarbon interface, and that this environment may modulate weak interactions between the labeled side chain and the protein surface. In the case of BtuB, lipid acyl chain packing is not symmetric around the β-barrel, and EPR spectra from labeled hydrocarbon-facing sites in BtuB may reflect this asymmetry. In addition to facilitating the interpretation of EPR spectra of membrane proteins, these results have important implications for the use of long-range distance restraints in protein structure refinement that are obtained from spin-labels.


Figures

Figure 1
Figure 1
a) Model for the spin-labeled side chain R1 obtained by derivatization with an MTSL spin label. Five rotatable bonds link the R1 spin label to the protein backbone, but motions that average the nitroxide magnetic interactions are often dominated by motion about χ4 and χ5 (see text). b) Model of BtuB (PDB ID: 1NQH ()) showing the position of 10 Cα carbons that have been spin-labeled with the side chain R1. Previous work () indicates that when reconstituted into POPC bilayers, sites near the aqueous solvent interface c) tend to yield EPR spectra that are multicomponent (yellow spheres), whereas at sites in the membrane interior d) yield EPR spectra that are near the rigid-limit (red spheres). All spectra are 100 Gauss scans, and normalized to equivalent spin numbers, except amplitudes of the spectra in d) are scaled by a factor of 1.5. The arrows in d) indicate the positions of the hyperfine extrema in the EPR spectrum, which are not averaged in rigid-limit EPR spectra.
Figure 2
Figure 2
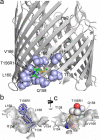
a) The 90 K x-ray crystal structure of BtuB T156R1 (PDB ID: 3RGM) determined at 2.6Å showing the R1 side chain (in a stick representation) and the positions of the nearest neighbor residues in a Corey, Pauling Koltun rendering. In b) and c) are shown alternate views of the site around T156R1, with the van der Waals surface shown in grey. In b) the 2Fo-Fc electron density is shown as blue mesh contoured at 1σ. Data collection and refinement statistics are given in Table 1.
Figure 3
Figure 3
The BtuB T156R1 crystal structure superposed on the wild-type coordinates (PDB ID: 1NQE). T156R1 nearest-neighbor residues from the spin-labeled structure are rendered as sticks and shown in gray, whereas the same residues from the wild-type structure are shown in green. The Q158, L160 and L168 rotamers are altered upon introduction of R1 at residue 156.
Figure 4
Figure 4
EPR spectra obtained from BtuB T156R1 reconstituted into POPC bilayers (top) and from a sample of ~20-30 in-tact protein crystals suspended in crystallization buffer (bottom). The dashed line represents the fit to the POPC spectrum (see Table 3 for the fit parameters). The room temperature crystalline EPR spectrum consists of a single component undergoing fast rotational diffusion on the EPR timescale; the rate and anisotropy of the motion is similar to that for T156R1 in DLPC bilayers. All spectra are 100 Gauss scans.
Figure 5
Figure 5
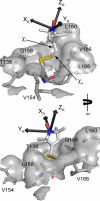
Rotational diffusion tensor frame for the fast component plotted onto the 156R1 crystal structure. From the correlation times determined from the MOMD fit (see Table 3), it is apparent that the label is executing rapid rotation about the χ4 and χ5 dihedrals.
Figure 6
Figure 6
EPR spectra of BtuB T156R1 reconstituted into POPC vesicles, and spectra from 11 mutants of T156R1, reconstituted into POPC bilayers, where the nearest neighboring residues have been mutated. These spectra include those from mutations to the i±2 residues (V154, Q158), the hydrogen-bonded (L168) and non-hydrogen bonded (T138) neighbors, and residue L160, which is on a periplasmic turn and forms the apex of a hydrophobic pocket near 156R1. The dashed lines below each spectrum represent the MOMD simiulations for each spectrum (see Table 3 for the parameters used to generate each spectrum). All spectra are 100 Gauss scans.
Figure 7
Figure 7
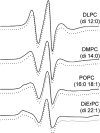
A comparison of T156R1 EPR spectra at 23°C that are reconstituted into lipid bilayers of increasing hydrocarbon thickness. The hydrocarbon thicknesses, determined previously (, ), are approximately 19.5, 25.0, 27.1 and 43.4 for DLPC, DMPC, POPC and DiErPC, respectively. The EPR lineshapes are shown in the solid traces and the MOMD fits are shown as the dashed lines below each spectrum. The DLPC spectrum could be fit with a single component, and the population of a second slow component increases with bilayer thickness (see Table 3 for the MOMD parameters). These spectra were reported elsewhere, but did not include the MOMD simulations ().
Figure 8
Figure 8
Saturation recovery data (black traces) for 156R1 reconstituted into DLPC (top), POPC (middle), and DiErPC (bottom) bilayers. Each signal could be fit with a single exponential recovery function (white trace), and the T1s are indicated in the figure. The residual to the fit is shown in grey. The first ~100 data points representing the microwave defense pulse were omitted from the fits and figures.
Figure 9
Figure 9
Effect of dioxane on the EPR spectrum from BtuB 156R1. Spectra are shown in the absence of dioxane (black trace) and in the presence of 5% v/v (blue trace) and 10% (red trace) dioxane. In POPC bilayers, dioxane increases the population of the fast component, consistent with the proposal that the slow label conformer results from an interaction of the label with a hydrophobic pocket on the protein surface. In DiErPC bilayers, dioxane does not affect the rotameric equilibrium, presumably because this interaction is much stronger in lipid bilayers of greater thickness.
Figure 10
Figure 10
a) The 90 K x-ray crystal structure of BtuB W371R (PDB ID: 3RGN) determined at 2.3 Å showing the R1 side chain (in a stick representation) and the positions of the nearest neighbor residues in a Corey, Pauling Koltun rendering. In b) and c) are shown alternate views of the site around W371R1, with the van der Waals surface shown in grey. W371R1 sits in a pocket formed by residues T373 and Y389. In b) the 2Fo-Fc electron density is shown as blue mesh contoured at 1σ. Data collection and refinement statistics are given in Table 1.
Figure 11
Figure 11
EPR spectra of BtuB G170R1 reconstituted into POPC and DMPC bilayers, and spectra from 4 mutations surrounding G170R1, reconstituted into POPC bilayers, where single alanine mutations were made to the nearest neighboring residues. These spectra include those from mutations to the i±2 residues (Y172, L168), the hydrogen-bonded (V154) and non-hydrogen bonded (L202) neighbors. All spectra are 100 Gauss scans.

Similar articles

Cited by

References

    1. Klug CS, Feix JB. Methods and applications of site-directed spin labeling EPR spectroscopy. Methods Cell Biol. 2008;84:617–658. - PubMed
    1. Jeschke G, Polyhach Y. Distance measurements on spin-labelled biomacromolecules by pulsed electron paramagnetic resonance. Physical Chemistry Chemical Physics. 2007;9:1895–1910. - PubMed
    1. Fanucci GE, Cafiso DS. Recent advances and applications of site-directed spin labeling. Curr Opin Struct Biol. 2006;16:644–653. - PubMed
    1. Hubbell WL, Cafiso DS, Altenbach C. Identifying conformational changes with site-directed spin labeling. Nat Struct Biol. 2000;7:735–739. - PubMed
    1. Hubbell WL, Gross A, Langen R, Lietzow MA. Recent advances in site-directed spin labeling of proteins. Curr Opin Struct Biol. 1998;8:649–656. - PubMed

Publication types

MeSH terms