. 2011 Oct;10(5):417-29.
doi: 10.7785/tcrt.2012.500219.

Imaging tumor oxyhemoglobin and deoxyhemoglobin concentrations with ultrasound-guided diffuse optical tomography

Affiliations

Imaging tumor oxyhemoglobin and deoxyhemoglobin concentrations with ultrasound-guided diffuse optical tomography

Nrusingh C Biswal et al. Technol Cancer Res Treat. 2011 Oct.

Abstract

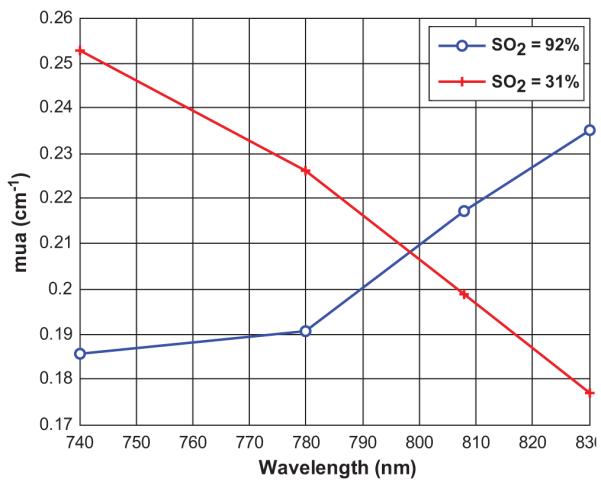
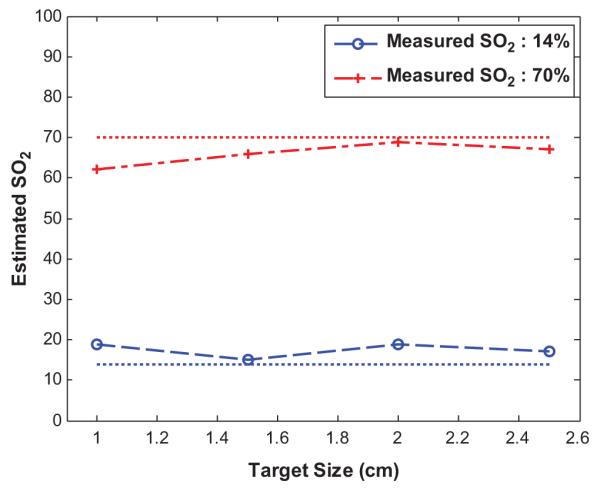
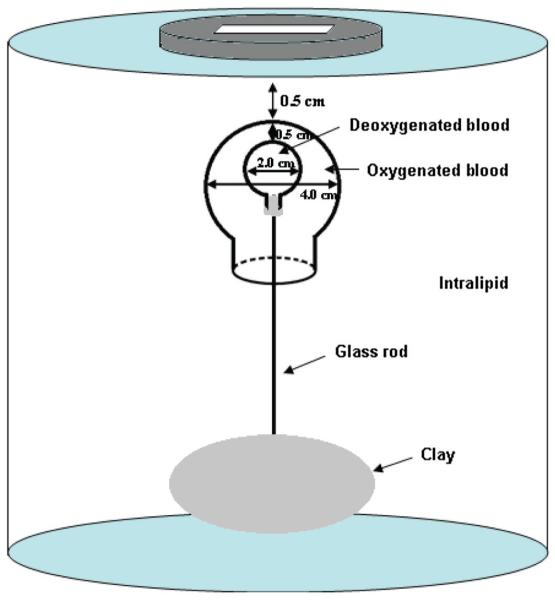
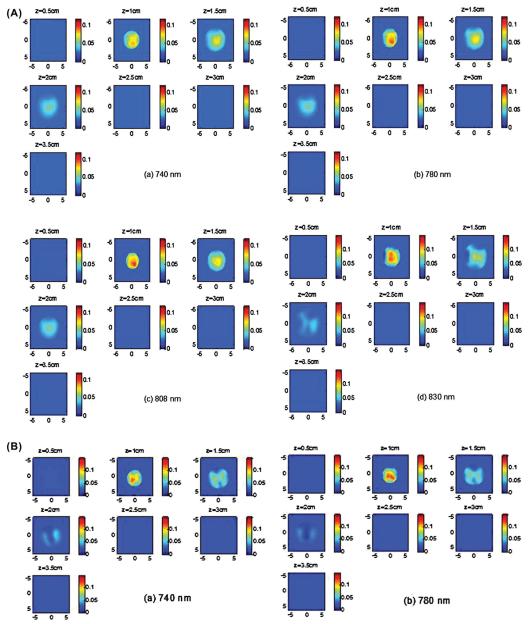
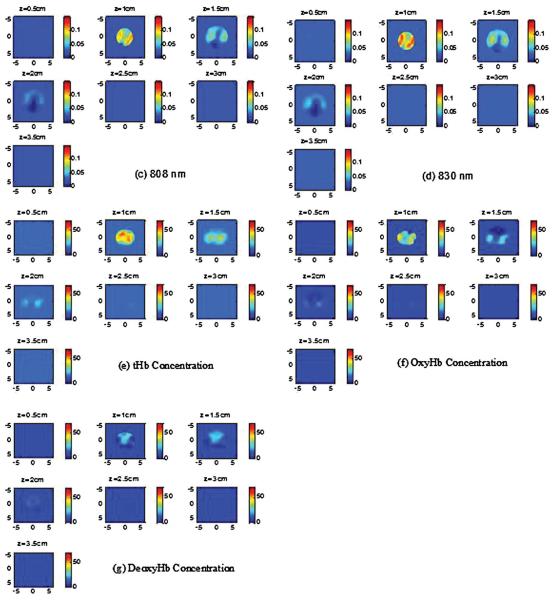
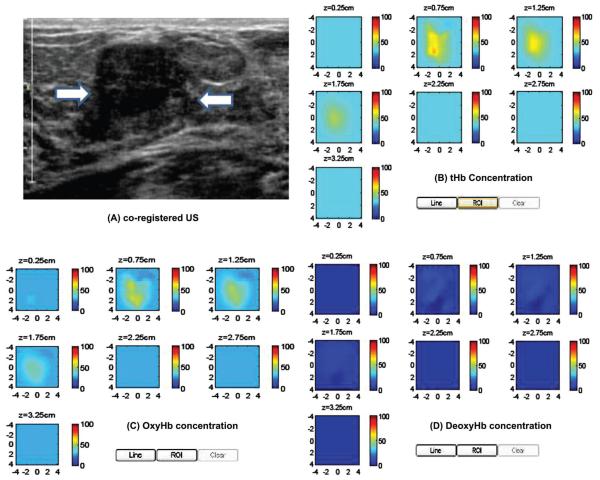
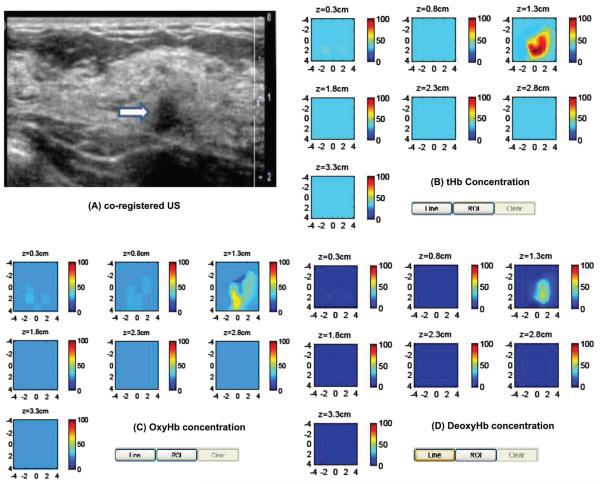
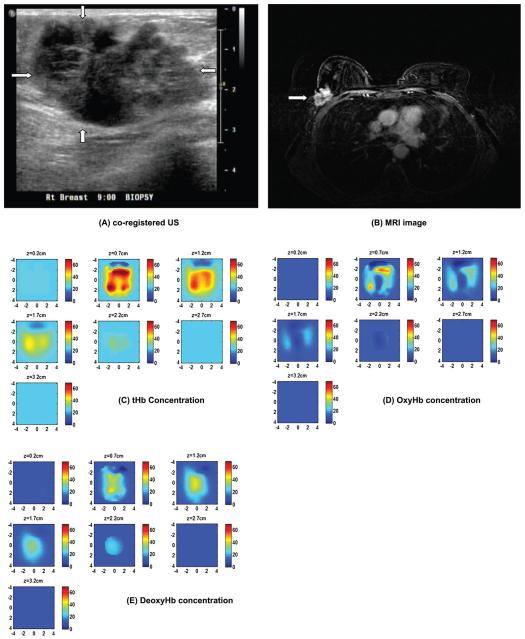
We present an ultrasound (US)-guided diffuse optical tomography for mapping tumor deoxyhemoglobin (deoxyHb) and oxyhemoglobin (oxyHb) concentrations in blood phantoms and in in-vivo patients. Because oxyHb and deoxyHb respond differently at different wavelengths, four laser diodes of wavelengths 740 nm, 780 nm, 808 nm and 830 nm were used in the study. Tumor model experiments were performed using phantoms of different hemoglobin oxygen saturations (14%-89%) representing hemoglobin oxygenation in tissue. Targets of different sizes and located at different depths were used to validate the accuracy of oxygen saturation estimation. The absolute deviations between the estimated hemoglobin oxygen saturations obtained from reconstructed absorption maps and oxygen measurements obtained using a pO2 electrode were less than 8% over the measured range of oxygen saturation. An inhomogeneous concentric blood phantom of deoxygenated center core and oxygenated outer shell was imaged and deoxyHb and oxyHb maps revealed corresponding distributions which correlated well with inhomogeneous deoxy- and oxy- distributions frequently seen in breast cancers. Clinical examples are given to demonstrate the utility of US-guided optical tomography in mapping heterogeneous deoxyHb and oxyHb distributions in breast cancers.


Figures

Figure 1
Figure 1
Measured maximum absorption coefficients at 4 wavelengths under two different oxygen conditions of SO2 = 92% and SO2 = 31%. The isobestic point is estimated at 798 nm.
Figure 2
Figure 2
Measured oxygen saturation versus estimated oxygen saturation obtained using equation [6]. The 2.0 cm target was located at different depth.
Figure 3
Figure 3
Target size versus estimated SO2 obtained at two oxygen saturation conditions.
Figure 4
Figure 4
Sketch of the concentric target and experimental set-up.
Figure 5
Figure 5
(A) (a)-(d) Reconstructed absorption maps of the 4.0 cm oxy-target without deoxy-core at four wavelengths of 740 nm (a), 780 nm (b), 808 nm (c), and 830 nm (d), respectively. Each map has 7 sub-images. Each sub-image shows a spatial x-y absorption distribution at the corresponding depth marked on the title of the sub-image. The depth increment is 0.5 cm. The dimensions of the sub-image are 9 cm by 9 cm. In the following Figures, the dimensions of the absorption are the same as Figure 5. The color bars for absorption coefficients were from 0 to 0.12 cm−1. (B) (a)-(d) Reconstructed absorption maps of the concentric target with deoxy-core at four wavelengths of 740 nm (a), 780 nm (b), 808 nm (c), and 830 nm (d), respectively. (e)-(g) tHb, oxyHb, and deoxyHb maps of the concentric target, respectively. The color bars for absorption coefficients were from 0 to 0.14 cm−1; and the values for hemoglobin concentrations were from 0 to 70 μM.
Figure 5
Figure 5
(A) (a)-(d) Reconstructed absorption maps of the 4.0 cm oxy-target without deoxy-core at four wavelengths of 740 nm (a), 780 nm (b), 808 nm (c), and 830 nm (d), respectively. Each map has 7 sub-images. Each sub-image shows a spatial x-y absorption distribution at the corresponding depth marked on the title of the sub-image. The depth increment is 0.5 cm. The dimensions of the sub-image are 9 cm by 9 cm. In the following Figures, the dimensions of the absorption are the same as Figure 5. The color bars for absorption coefficients were from 0 to 0.12 cm−1. (B) (a)-(d) Reconstructed absorption maps of the concentric target with deoxy-core at four wavelengths of 740 nm (a), 780 nm (b), 808 nm (c), and 830 nm (d), respectively. (e)-(g) tHb, oxyHb, and deoxyHb maps of the concentric target, respectively. The color bars for absorption coefficients were from 0 to 0.14 cm−1; and the values for hemoglobin concentrations were from 0 to 70 μM.
Figure 6
Figure 6
Clinical example of a benign fibroadenoma. (A) Co-registered US showed a suspicious 2 cm solid mass on the right breast of a 26-years-old woman. (B)-(D) computed tHb, oxyHb and deoxyHb maps. The absorption maps at all wavelengths (not shown) and computed hemoglobin concentration maps were homogeneous.
Figure 7
Figure 7
Clinical example of a stage I breast cancer. (A) Co-registered US showed a suspicious 1 cm mass on the left breast of a 61-years-old woman. (B)-(D) computed tHb, oxyHb and deoxyHb maps. The absorption maps of 740 nm, 780 nm and 808 nm are quite homogeneous, however, the map at 830 nm shows more periphery distribution (not shown). As a result, the computed oxyHb shows more periphery distribution.
Figure 8
Figure 8
Ultrasound image of an advanced breast cancer located at the right breast of a 64-years-old woman (A), and MRI image of the cancer (B) marked by the arrow head. (C)-(F) computed tHb, oxyHb, and deoxyHb maps, respectively. The absorption map at 740 nm shows higher value at the core; while the absorption at 830 nm reveals higher value at periphery (not shown). As a result, the deoxyHb shows a higher value at the core and oxyHb map reveals periphery distribution. The color bars for hemoglobin concentrations are from 0 to 70 μM.

References

    1. Vaupel P, Kallinowski F, Okunieff P. Blood flow, oxygen and nutrient supply, and metabolic microenvironment of human tumors: a review. Cancer Res. 1989;49:6449–6465. - PubMed
    1. Brizel DM, Rosner GL, Prosnitz LR, Dewhirst MW. Patterns and variability of tumor oxygenation in human soft tissue sarcomas, cervical carcinomas and lymph node metastasis. Int J Radiat Oncol Biol Phys. 1995;31:1121–1125. - PubMed
    1. Hohenberger P, Flegner C, Haensh W, Schlag PM. Tumor oxyoxy-genation correlates with molecular growth determinants in breast cancer. Breast Cancer Res. 1998;48:97–106. - PubMed
    1. Knowles H, Harris AL. Hypoxia and oxidative stress in breast cancer hypoxia and tumourigenesis. Breast Cancer Research. 2001;3:318–322. - PMC - PubMed
    1. Hockel M, Aupel PV. Biological consequences of tumor hypoxia. Semin Oncol. 2001;28:36–41. - PubMed

Publication types