. 2011 Sep;130(3):1567-80.
doi: 10.1121/1.3621445.

Detection and rate discrimination of amplitude modulation in electrical hearing

Affiliations

Detection and rate discrimination of amplitude modulation in electrical hearing

Monita Chatterjee et al. J Acoust Soc Am. 2011 Sep.

Abstract

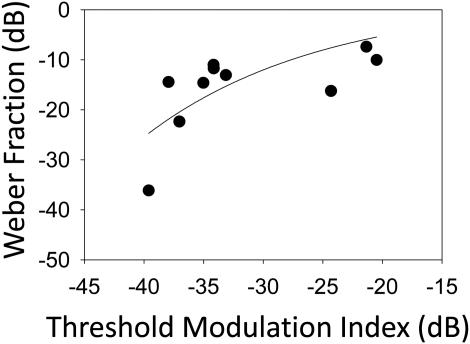
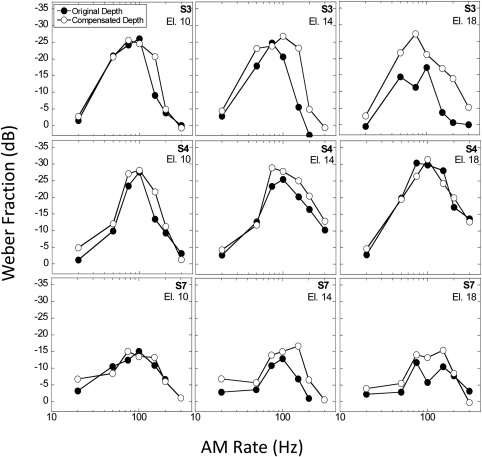
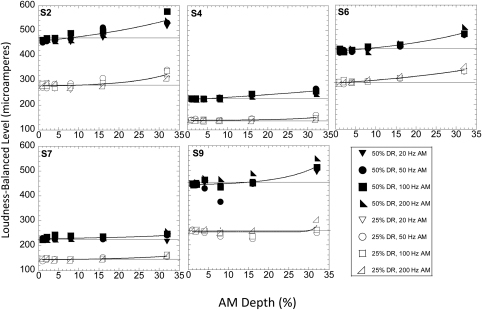
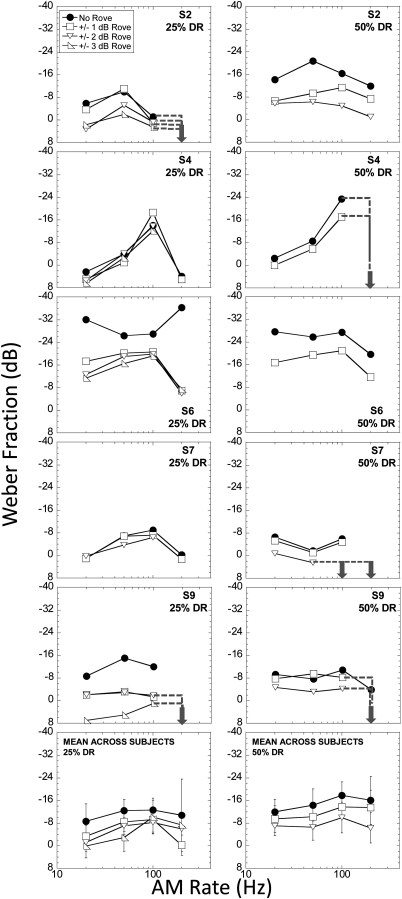
Three experiments were designed to examine temporal envelope processing by cochlear implant (CI) listeners. In experiment 1, the hypothesis that listeners' modulation sensitivity would in part determine their ability to discriminate between temporal modulation rates was examined. Temporal modulation transfer functions (TMTFs) obtained in an amplitude modulation detection (AMD) task were compared to threshold functions obtained in an amplitude modulation rate discrimination (AMRD) task. Statistically significant nonlinear correlations were observed between the two measures. In experiment 2, results of loudness-balancing showed small increases in the loudness of modulated over unmodulated stimuli beyond a modulation depth of 16%. Results of experiment 3 indicated small but statistically significant effects of level-roving on the overall gain of the TMTF, but no impact of level-roving on the average shape of the TMTF across subjects. This suggested that level-roving simply increased the task difficulty for most listeners, but did not indicate increased use of intensity cues under more challenging conditions. Data obtained with one subject, however, suggested that the most sensitive listeners may derive some benefit from intensity cues in these tasks. Overall, results indicated that intensity cues did not play an important role in temporal envelope processing by the average CI listener.


Figures

Figure 1
Figure 1
(Color online) Individual threshold functions for the AMD and AMRD tasks in experiment 1. AMD thresholds (in dB [20*log(m)]) and AMRD thresholds (dB [20*log(w)]) are shown as a function of AM rate (Hz). Different symbols correspond to data obtained at the three electrode locations (insets in top left-hand panels). Vertical scales for both AMD and AMRD thresholds span a 40 dB range. The dotted lines in each panel showing the AMD data represent the estimated best measurable AMD thresholds given device limitations.
Figure 2
Figure 2
(Color online) Subject S6’s AMRD thresholds (dB [20*log(w)]) as function of AM rate (Hz) for the standard carrier pulse rate (2000 pps) and a higher carrier pulse rate (4000 pps) on electrode 10.
Figure 3
Figure 3
Scatterplot of mean AMD and AMRD thresholds obtained in experiment 1 showing a non-linear relationship (solid line and equation indicates best-fitting function). AMD and AMRD thresholds were averaged across electrodes and all AM rates for each subject.
Figure 4
Figure 4
(Color online) AMRD threshold functions for subjects S3, S4, and S7 obtained at the “original” fixed AM depth of 20% and at a “compensated” AM depth (20% + AMD threshold) at three electrode locations (els. 10, 14, and 18, shown in left, middle and right panels, respectively).
Figure 5
Figure 5
(Color online) Individual subjects’ loudness-balanced levels (μA) for AM stimuli at six AM depths (1%, 2%, 4%, 8%, 16%, and 32%) and four AM rates (20, 50, 100, and 200 Hz) obtained in experiment 2. The ordinate shows the level of the unmodulated pulse train that matches the loudness of the pulse train modulated at the specific depth and rate. Filled and open symbols show results obtained with the two carrier reference levels (25% and 50% DR), respectively. The solid horizontal line in each case shows the unmodulated carrier level (μA).
Figure 6
Figure 6
(Color online) Normalized loudness-balanced levels (re. 1% depth, shown by the solid horizontal line in each panel) plotted as a function of AM depth for individual subjects at the two carrier reference levels (25% and 50%DR) in experiment 2. The left-hand ordinate is expressed in linear units while the right-hand ordinate displays dB values corresponding to those linear units. The lower right-hand panel shows the mean normalized loudness-balanced levels across subjects. Error bars in all panels show ±1 s.d. from the mean. For individual subjects, s.d. was computed across AM rates. For the averaged normalized data shown in the lower right-hand panel, the s.d. reflects variation across subjects.
Figure 7
Figure 7
(Color online) Effects of level-roving on AMD TMTFs for the 5 subjects who participated in experiment 3. Each plot shows AMD thresholds as a function of AM rate under different level-roving conditions (No Rove, ±1, ±2, and ±3 dB). The left-hand panel displays the results of roving at a 25% DR reference carrier level, and the right-hand panel for a 50% DR reference carrier level. The lower panels show the mean AMD TMTFs across subjects, with error bars reflecting ±1 s.d. from the mean.
Figure 8
Figure 8
(Color online) Effects of level-roving on AMRD threshold functions for the 5 subjects who participated in experiment 3. AM depths were compensated for salience when AMD thresholds exceeded m of 5%. Gray dotted lines and arrows indicate conditions in which thresholds were too high to be measurable. Remaining aspects of plots are identical to those in Fig. 8. Other missing data correspond to conditions in which roving led to excessive loudness.

References

    1. Boex, C., Baud, L., Cosendai, G., Sigrist, A., Kos, M. I., and Pelizzone M. (2006). “Acoustic to electric pitch comparisons in cochlear implant subjects with residual hearing,” J. Assoc. Res. Otolayngol. 7(2), 110–124. 10.1007/s10162-005-0027-2 - DOI - PMC - PubMed
    1. Chatterjee, M. (2003). “Modulation masking in cochlear implant listeners: Envelope vs. tonotopic components,” J. Acoust. Soc. Am. 113(4), 2042–2053. 10.1121/1.1555613 - DOI - PubMed
    1. Chatterjee, M., Fu, Q.-J., and Shannon, R. V. (2000). “Effects of phase duration and electrode separation on loudness growth in cochlear implant listeners,” J. Acoust. Soc. Am. 107(3), 1637–1644. 10.1121/1.428448 - DOI - PubMed
    1. Chatterjee, M., and Oba, S. I. (2004). “Across- and within-channel envelope interactions in cochlear implant listeners,” J. Assoc. Res. Otolaryngol. 5(4), 360–375. 10.1007/s10162-004-4050-5 - DOI - PMC - PubMed
    1. Chatterjee, M., and Oba, S. I. (2005). “Noise improves modulation detection by cochlear implant listeners at moderate carrier levels.” J. Acoust. Soc. Am. 118(2), 993–1002. 10.1121/1.1929258 - DOI - PubMed

Publication types

MeSH terms