

First-in-human pilot study of a spatial frequency domain oxygenation imaging system
- PMID: 21895327
- PMCID: PMC3182084
- DOI: 10.1117/1.3614566
First-in-human pilot study of a spatial frequency domain oxygenation imaging system
Abstract
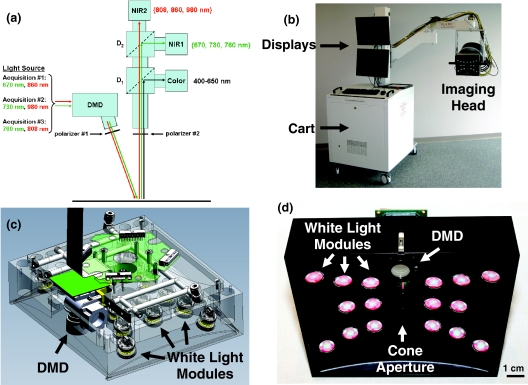
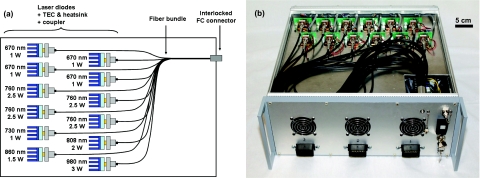
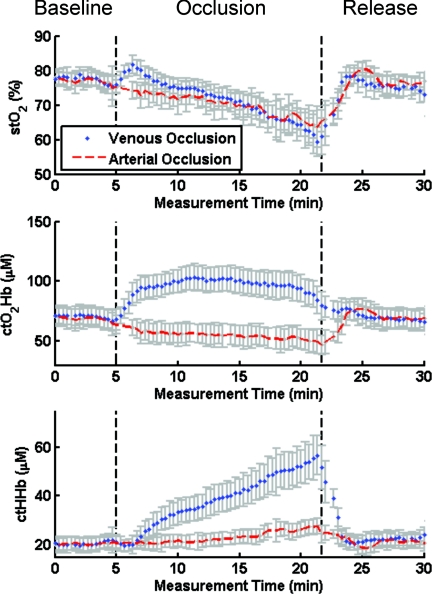
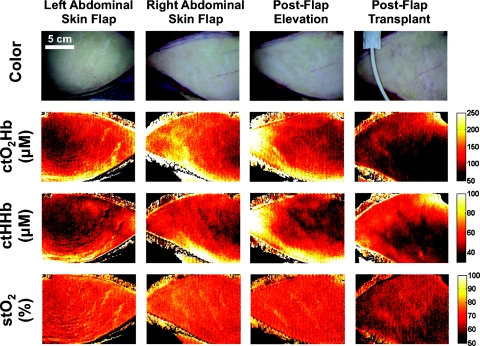
Oxygenation measurements are widely used in patient care. However, most clinically available instruments currently consist of contact probes that only provide global monitoring of the patient (e.g., pulse oximetry probes) or local monitoring of small areas (e.g., spectroscopy-based probes). Visualization of oxygenation over large areas of tissue, without a priori knowledge of the location of defects, has the potential to improve patient management in many surgical and critical care applications. In this study, we present a clinically compatible multispectral spatial frequency domain imaging (SFDI) system optimized for surgical oxygenation imaging. This system was used to image tissue oxygenation over a large area (16×12 cm) and was validated during preclinical studies by comparing results obtained with an FDA-approved clinical oxygenation probe. Skin flap, bowel, and liver vascular occlusion experiments were performed on Yorkshire pigs and demonstrated that over the course of the experiment, relative changes in oxygen saturation measured using SFDI had an accuracy within 10% of those made using the FDA-approved device. Finally, the new SFDI system was translated to the clinic in a first-in-human pilot study that imaged skin flap oxygenation during reconstructive breast surgery. Overall, this study lays the foundation for clinical translation of endogenous contrast imaging using SFDI.
Figures


Similar articles
-
A novel pilot study using spatial frequency domain imaging to assess oxygenation of perforator flaps during reconstructive breast surgery.Ann Plast Surg. 2013 Sep;71(3):308-15. doi: 10.1097/SAP.0b013e31828b02fb. Ann Plast Surg. 2013. PMID: 23945533 Free PMC article. Clinical Trial.
-
Intraoperative Hemifacial Composite Flap Perfusion Assessment Using Spatial Frequency Domain Imaging: A Pilot Study in Preparation for Facial Transplantation.Ann Plast Surg. 2016 Feb;76(2):249-55. doi: 10.1097/SAP.0000000000000631. Ann Plast Surg. 2016. PMID: 26418791 Free PMC article.
-
Investigation of TRAM flap oxygenation and perfusion by near-infrared reflection spectroscopy and color-coded duplex sonography.Plast Reconstr Surg. 2004 Jan;113(1):141-52; discussion 153-5. doi: 10.1097/01.PRS.0000095940.96294.A5. Plast Reconstr Surg. 2004. PMID: 14707632
-
Near-infrared spectroscopy: a methodology-focused review.Semin Fetal Neonatal Med. 2011 Feb;16(1):42-9. doi: 10.1016/j.siny.2010.05.003. Epub 2010 Jun 26. Semin Fetal Neonatal Med. 2011. PMID: 20580625 Review.
-
Tissue Oximetry and Clinical Outcomes.Anesth Analg. 2017 Jan;124(1):72-82. doi: 10.1213/ANE.0000000000001348. Anesth Analg. 2017. PMID: 27308951 Review.
Cited by
-
First experience with spatial frequency domain imaging and red-light excitation of protoporphyrin IX fluorescence during tumor resection.Biomed Opt Express. 2020 Jul 15;11(8):4306-4315. doi: 10.1364/BOE.397507. eCollection 2020 Aug 1. Biomed Opt Express. 2020. PMID: 32923044 Free PMC article.
-
Quantitative spatial mapping of tissue water and lipid content using spatial frequency domain imaging in the 900- to 1000-nm wavelength region.J Biomed Opt. 2022 Oct;27(10):105005. doi: 10.1117/1.JBO.27.10.105005. J Biomed Opt. 2022. PMID: 36303279 Free PMC article.
-
Intraoperative hyperspectral label-free imaging: from system design to first-in-patient translation.J Phys D Appl Phys. 2021 Jul 22;54(29):294003. doi: 10.1088/1361-6463/abfbf6. Epub 2021 May 14. J Phys D Appl Phys. 2021. PMID: 34024940 Free PMC article.
-
Deep spectral learning for label-free optical imaging oximetry with uncertainty quantification.Light Sci Appl. 2019 Nov 20;8:102. doi: 10.1038/s41377-019-0216-0. eCollection 2019. Light Sci Appl. 2019. PMID: 31754429 Free PMC article.
-
Compressed single pixel imaging in the spatial frequency domain.J Biomed Opt. 2017 Mar 1;22(3):30501. doi: 10.1117/1.JBO.22.3.030501. J Biomed Opt. 2017. PMID: 28300272 Free PMC article.
References
-
- Mendelson Y., “Pulse oximetry: theory and applications for noninvasive monitoring,” Clin. Chem 38, 1601–1607 (1992). - PubMed
-
- Middleton P. M. and Henry J. A., “Pulse oximetry: evolution and directions,” Int. J. Clin. Pract. 54, 438–444 (2000). - PubMed
-
- Rao R., Saint-Cyr M., Ma A. M., Bowling M., Hatef D. A., Andrews V., Xie X. J., Zogakis T., and Rohrich R., “Prediction of post-operative necrosis after mastectomy: a pilot study utilizing optical diffusion imaging spectroscopy,” World J. Surg. Oncol. 7, 91 (2009).10.1186/1477-7819-7-91 - DOI - PMC - PubMed
Publication types
MeSH terms
Substances
Grants and funding
LinkOut - more resources
Full Text Sources
Other Literature Sources
