Case Reports
. 2011 Oct;89(10):723-36.
doi: 10.1139/y11-070. Epub 2011 Sep 6.

Multiple arrhythmic syndromes in a newborn, owing to a novel mutation in SCN5A

Affiliations
Case Reports

Multiple arrhythmic syndromes in a newborn, owing to a novel mutation in SCN5A

Kirstine Calloe et al. Can J Physiol Pharmacol. 2011 Oct.

Abstract

Background: Mutations in the SCN5A gene have been linked to Brugada syndrome (BrS), conduction disease, Long QT syndrome (LQT3), atrial fibrillation (AF), and to pre- and neonatal ventricular arrhythmias.

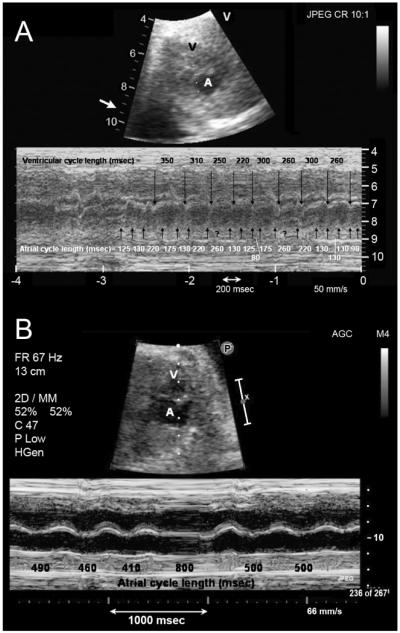
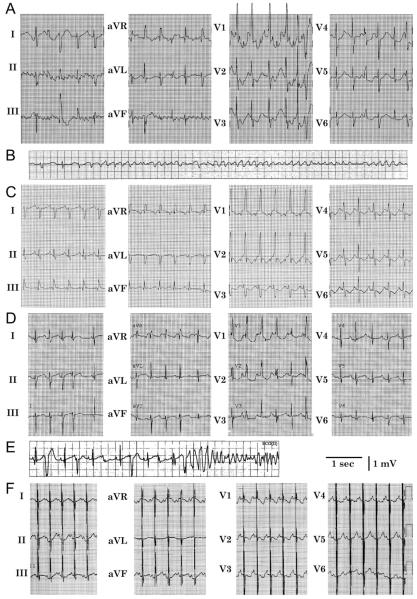
Objective: The objective of this study is to characterize a novel mutation in Na(v)1.5 found in a newborn with fetal chaotic atrial tachycardia, post-partum intraventricular conduction delay, and QT interval prolongation.

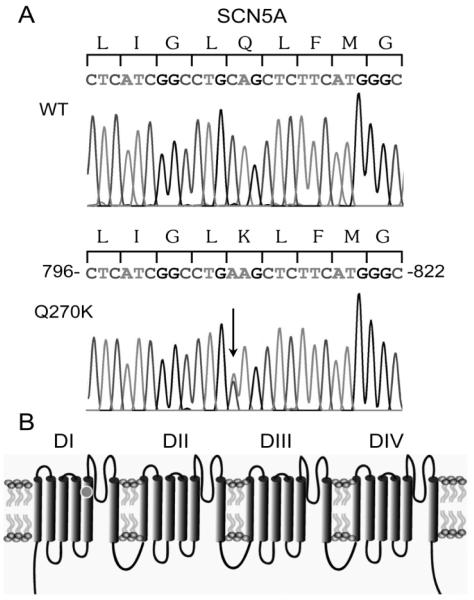
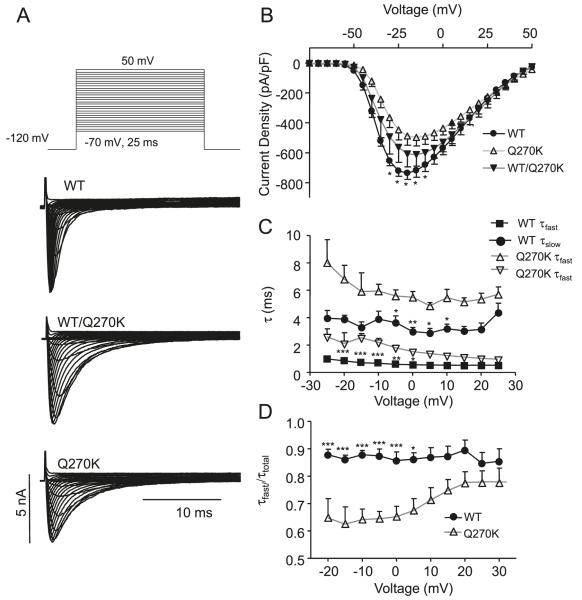
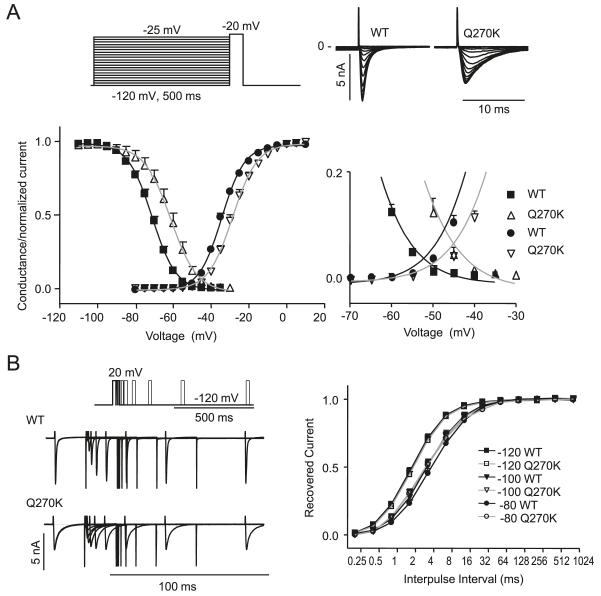
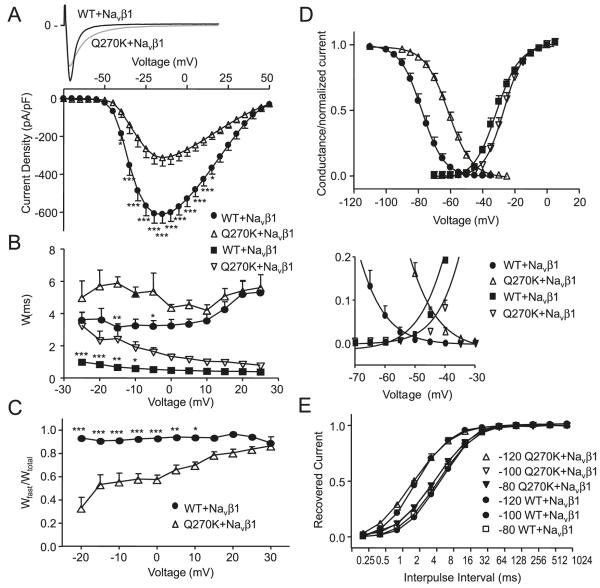
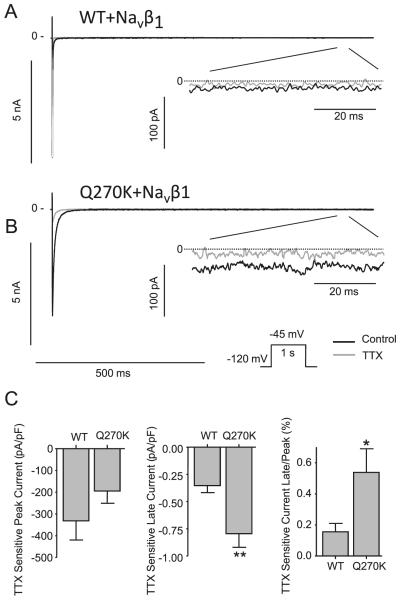
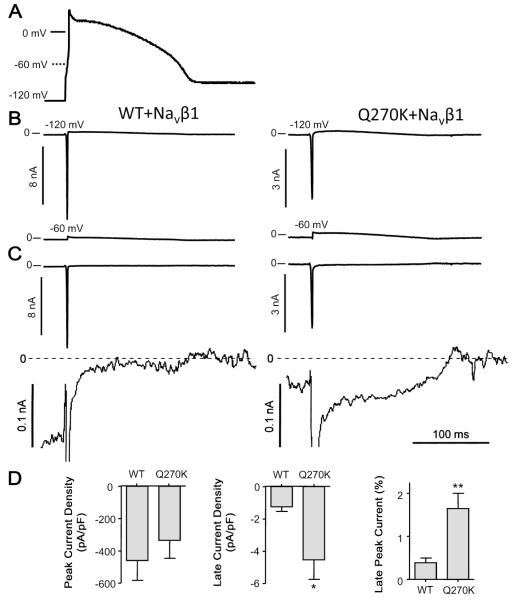
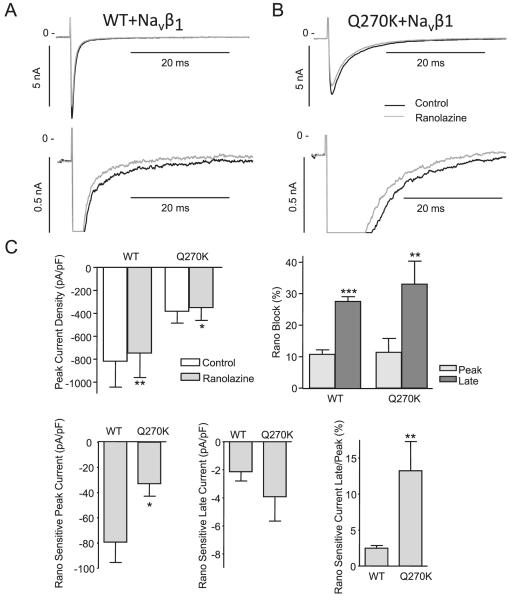
Methods: Genomic DNA was isolated and all exons and intron borders of 15 ion-channel genes were sequenced, revealing a novel missense mutation (Q270K) in SCN5A. Na(v)1.5 wild type (WT) and Q270K were expressed in CHO-K1 with and without the Na(v)β1 subunit. Results. Patch-clamp analysis showed ∼40% reduction in peak sodium channel current (I(Na)) density for Q270K compared with WT. Fast and slow decay of I(Na) were significantly slower in Q270K. Steady-state activation and inactivation of Q270K channels were shifted to positive potentials, and window current was increased. The tetrodotoxin-sensitive late I(Na) was increased almost 3-fold compared with WT channels. Ranolazine reduced late I(Na) in WT and Q270K channels, while exerting minimal effects on peak I(Na).

Conclusion: The Q270K mutation in SCN5A reduces peak I(Na) while augmenting late I(Na), and may thus underlie the development of atrial tachycardia, intraventricular conduction delay, and QT interval prolongation in an infant.


Figures

Fig. 1
Fig. 1
(A) Two-dimensional fetal echocardiogram at 29 weeks gestation showing a frame from sector scan (above) and accompanying m-mode (below). Illustrated are mechanical atrial events at a very rapid and irregular rate (indicated by upward pointing arrows) and slower mechanical ventricular events (indicated by downward pointing arrows). (B) Fetal echocardiogram using the same format and obtained 3 days later after administration of sotalol to the mother, illustrating a normal atrial rate (indicated by upward pointing arrows) and a sinus pause. A, atrium; V, ventricle.
Fig. 2
Fig. 2
(A) Twelve lead ECG of the proband soon after birth showing atrial flutter. (B) This deteriorated into ventricular fibrillation, requiring defibrillation. (C) Sinus rhythm on the 5th day of life, demonstrating intraventricular conduction delay. (D) During treatment with amiodarone on the 10th day of life, there was prolongation of the QTc interval (491 ms in V5 during period of stable sinus rhythm). (E) Also on the 10th day of life, following a short–long–short QRS sequence, torsade de pointes occurred. (F) Twelve lead ECG at 23 months of age while drug-free, showing normal QRS duration and QTc interval prolongation (466 ms). Pacing spikes account for pseudofusion.
Fig. 3
Fig. 3
Electropherogram of the patient’s DNA showing a heterozygous C to A transition at nucleotide position 808 in exon 7 in SCN5A (A), resulting in a substitution of glutamine (Q) to a lysine (K) at position 270 (Q270K) in S5 of the first domain (D1) of the Nav1.5 sodium channel, marked by a dot in (B).
Fig. 4
Fig. 4
Whole-cel1 current recordings for Nav1.5 wild type (WT) (n = 8), WT/Q270K (1:1 ratio, n = 6), and Q270K (n = 8). (A) Representative recordings. (B) Peak current density as a function of voltage. The asterisks indicate significant difference between WT and Q270K: *, p < 0.05; **, p < 0.01; and ***, p < 0.001. The difference between WT and WT/Q270K did not reach statistical significance. (C) Double exponential functions fit to the current decay and the resulting time-constants (τslow and τfast) plotted as a function of voltage. (D) The relative weight of the pre-exponential factors for τfasttotal as a function of voltage.
Fig. 5
Fig. 5
Activation and steady state-inactivation relation for Nav1.5 wild type (WT) (n = 9) and Q270K (n = 6). (A) Activation curves were calculated by normalizing the currents shown in Fig. 4 to (Vm–EK). Steady-state inactivation was determined using the protocol shown in the inset. Peak currents at −20 mV were normalized and plotted against the conditioning potential, and Boltzmann equations were fit to the data points. The overlap regions of the 2 relationships are enlarged. (B) Time-dependent recovery from inactivation for WT and Q270K. Currents were activated by a 2-pulse protocol from a holding of either −120 mV, −100 mV, or −80 mV. The fraction of recovered current was plotted as a function of interpulse interval, and single exponential functions were fitted to the data.
Fig. 6
Fig. 6
Whole-cell current recordings for Nav1.5 wild type (WT) (n = 11) and Q270K (n = 10) co-expressed with Navβ1 (1:1 ratio). (A) Representative currents and peak current densities shown as a function of voltage. (B) Double exponential functions were fit to current decay and the time-constants (τslow and τfast) are shown as a function of voltage. (C) Relative weight of the pre-exponential factors. (D) Activation curves were calculated by normalizing the currents shown in A to (Vm–EK). Steady-state inactivation was measured and peak currents at −20 mV were normalized, plotted against the conditioning potential, and Boltzmann equations were fit to the data points. The overlap regions are enlarged. (E) Time-dependent recovery from inactivation for WT/ Navβ1 and Q270K/Navβ1. Currents were activated by a 2-pulse protocol from a holding of either −120 mV, −100 mV, or −80 mV. The fraction of recovered current was plotted as a function of interpulse interval and single exponential functions were fit to the data. *, p < 0.05; **, p < 0.01; and ***, p < 0.001.
Fig. 7
Fig. 7
Effect of 10 μmol/L tetrodotoxin (TTX) on Nav1.5 wild type (WT) (n = 5) and Q270K (n = 5) co-expressed with Navβ1 (1:1 ratio). Currents were activated by a 1 s step to −45 mV from a holding potential of −120 mV at a frequency of 0.25 Hz. (A) Representative WT recordings in absence or presence of TTX. For comparison, the peak and late current are shown at different scales. (B) Representative Q270K recordings. (C) Summarized data of the effect of TTX on current density. Currents in presence of TTX were digitally subtracted from currents recorded in the absence of TTX to determine the TTX-sensitive current. Late current was measured as mean current after 950–990 ms and the ratio between the TTX-sensitive peak and late current was calculated for WT and Q270K. *, p < 0.05 and **, p < 0.01.
Fig. 8
Fig. 8
Wild type (WT) (n = 7) and Q270K (n = 6) co-expressed with Navβ1 (1:1 ratio). An action potential previously recorded from an isolated neonate canine ventricular cardiomyocyte paced at 1 Hz was used as command (A). (B) The command action potential was modified so that either a holding potential of −120 mV or −60 mV was imposed. (C) The recordings obtained using −60 mV as holding was digitally subtracted from the recordings obtained at −120 mV. For comparison, the peak and late current are shown at different scales. (D) Summary data of peak and late WT/Navβ1 and Q270K/Navβ1 current, as well as the ratio between late and peak current. Late current was measured as mean current 50 to 55 ms after the peak, corresponding to a potential of 22–23 mV. *, p < 0.05 and **, p < 0.01.
Fig. 9
Fig. 9
Effect of 50 μmol/L ranolazine on wild type (WT) (n = 7) and Q270K (n = 4) co-expressed with Navβ1 (1:1 ratio). Currents were activated by −20 mV step from a holding potential of −120 mV at a frequency of 0.25 Hz. (A) Representative WT recordings in the absence or presence of ranolazine. For comparison, the peak and late current are shown at different scales. (B) Representative Q270K recordings. (C) Summarized data of the effect of ranolazine on peak current density and percentage block of peak and late currents. The ranolazine sensitive currents were determined by digitally subtracting currents in presence of ranolazine from control. The late currents were determined as mean currents 45 to 50 ms after the peak and the ratio between the ranolazine sensitive peak and late current was calculated for WT and Q270K. *, p < 0.05; **, p < 0.01; and ***, p < 0.001.

References

    1. Abriel H. Cardiac sodium channel Na(v)1.5 and interacting proteins: physiology and pathophysiology. J. Mol. Cell. Cardiol. 2010;48(1):2–11. doi:10.1016/j.yjmcc.2009.08.025. PMID:19744495. - PubMed
    1. Ackerman MJ, Siu BL, Sturner WQ, Tester DJ, Valdivia CR, Makielski JC, Towbin JA. Postmortem molecular analysis of SCN5A defects in sudden infant death syndrome. JAMA. 2001;286(18):2264–2269. doi:10.1001/jama.286.18.2264. PMID:11710892. - PubMed
    1. Antzelevitch C, Brugada P, Borggrefe M, Brugada J, Brugada R, Corrado D, et al. Brugada syndrome: report of the second consensus conference. Endorsed by the Heart Rhythm Society and the European Heart Rhythm Association. Circulation. 2005;111(5):659–670. doi:10.1161/01.CIR.0000152479.54298.51. PMID:15655131. - PubMed
    1. Arnestad M, Crotti L, Rognum TO, Insolia R, Pedrazzini M, Ferrandi C, et al. Prevalence of long-QT syndrome gene variants in sudden infant death syndrome. Circulation. 2007;115(3):361–367. doi:10.1161/CIRCULATIONAHA.106.658021. PMID: 17210839. - PubMed
    1. Attwell D, Cohen I, Eisner D, Ohba M, Ojeda C. The steady state TTX-sensitive ("window") sodium current in cardiac Purkinje fibres. Pflugers Arch. 1979;379(2):137–142. doi:10.1007/ BF00586939. PMID:571107. - PubMed

Publication types