. 2012 Apr;165(8):2635-51.
doi: 10.1111/j.1476-5381.2011.01658.x.

Effects of palmitoylation of Cys(415) in helix 8 of the CB(1) cannabinoid receptor on membrane localization and signalling

Affiliations

Effects of palmitoylation of Cys(415) in helix 8 of the CB(1) cannabinoid receptor on membrane localization and signalling

Sergio Oddi et al. Br J Pharmacol. 2012 Apr.

Abstract

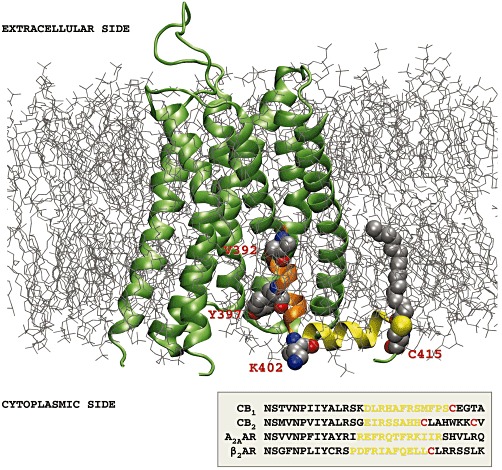
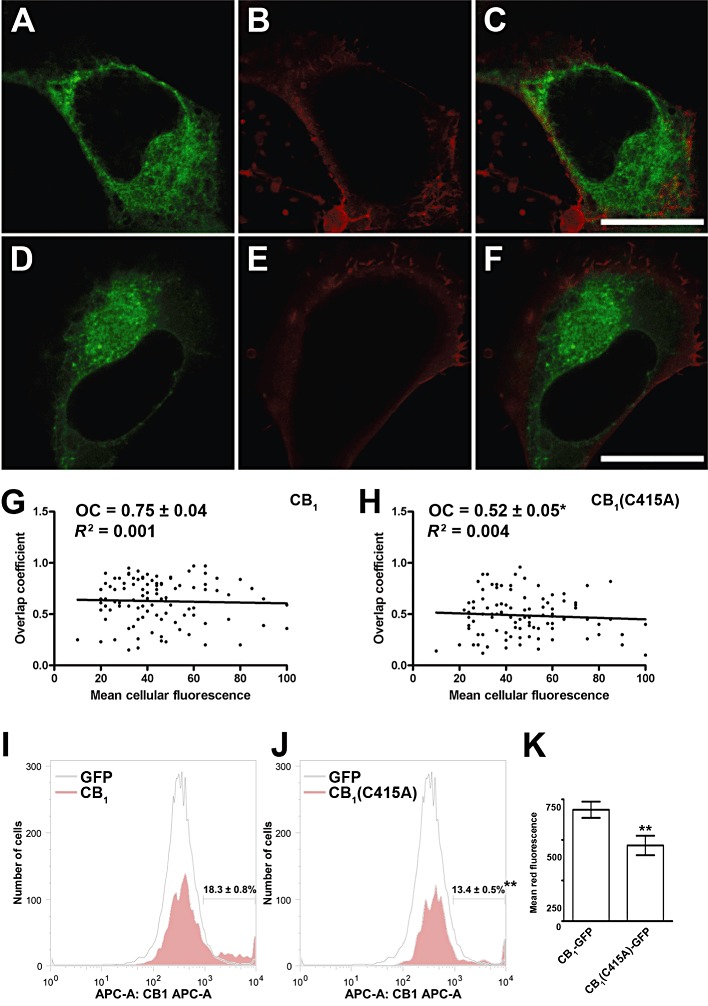
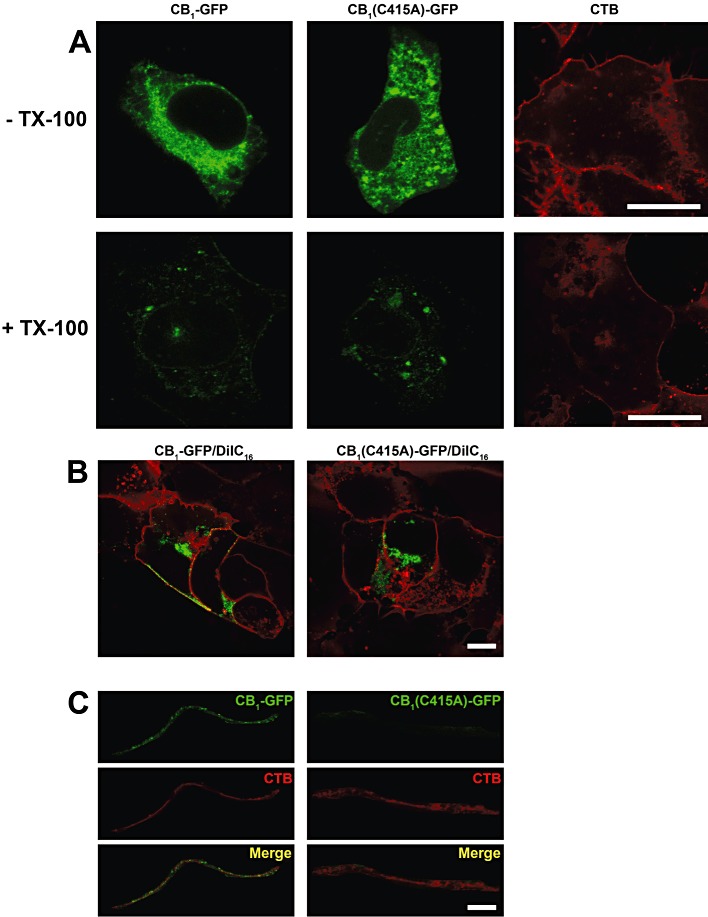
Background and purpose: The CB(1) cannabinoid receptor is regulated by its association with membrane microdomains such as lipid rafts. Here, we investigated the role of palmitoylation of the CB(1) receptor by analysing the functional consequences of site-specific mutation of Cys(415) , the likely site of palmitoylation at the end of helix 8, in terms of membrane association, raft targeting and signalling.

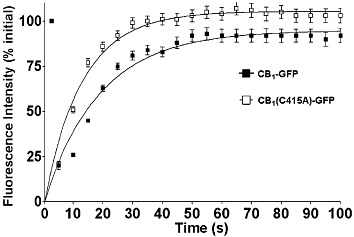
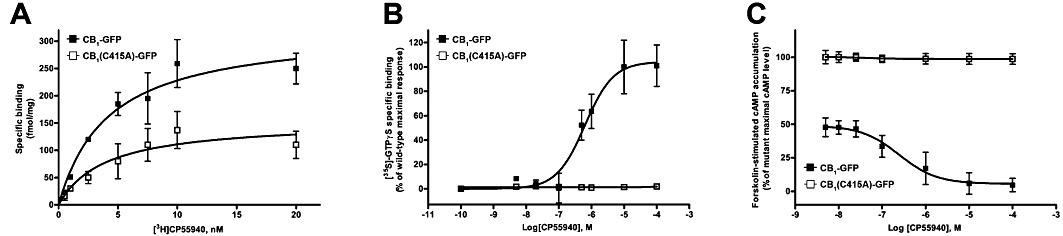
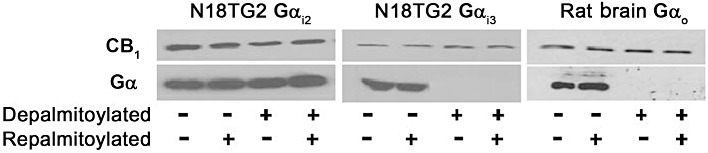
Experimental approach: The palmitoylation state of CB(1) receptors in rat forebrain was assessed by depalmitoylation/repalmitoylation experiments. Cys(415) was replaced with alanine by site-directed mutagenesis. Green fluorescence protein chimeras of both wild-type and mutant receptors were transiently expressed and functionally characterized in SH-SY5Y cells and HEK-293 cells by means of confocal microscopy, cytofluorimetry and competitive binding assays. Confocal fluorescence recovery after photobleaching was used to assess receptor membrane dynamics, whereas signalling activity was assessed by [(35) S]GTPγS, cAMP and co-immunoprecipitation assays.

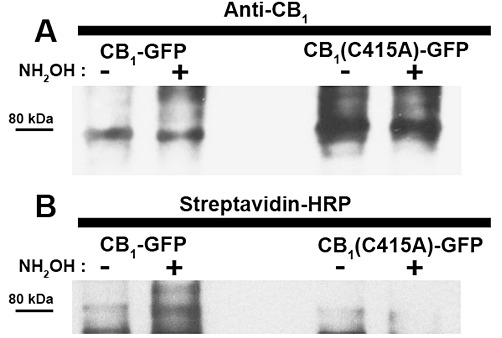
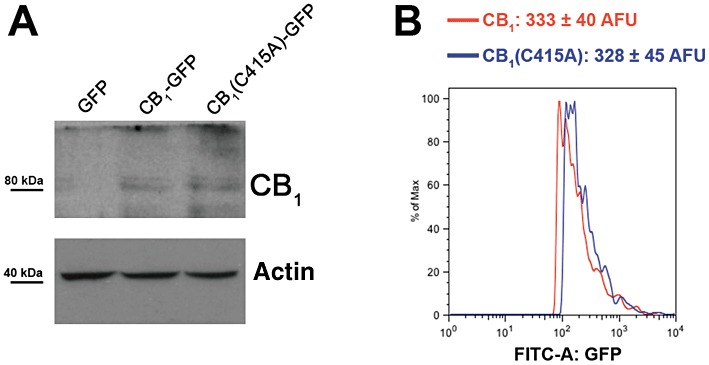
Key results: Endogenous CB(1) receptors in rat brain were palmitoylated. Mutation of Cys(415) prevented the palmitoylation of the receptor in transfected cells and reduced its recruitment to plasma membrane and lipid rafts; it also increased protein diffusional mobility. The same mutation markedly reduced the functional coupling of CB(1) receptors with G-proteins and adenylyl cyclase, whereas depalmitoylation abolished receptor association with a specific subset of G-proteins.

Conclusions and implications: CB(1) receptors were post-translationally modified by palmitoylation. Mutation of Cys(415) provides a receptor that is functionally impaired in terms of membrane targeting and signalling.

Linked articles: This article is part of a themed section on Cannabinoids in Biology and Medicine. To view the other articles in this section visit http://dx.doi.org/10.1111/bph.2012.165.issue-8. To view Part I of Cannabinoids in Biology and Medicine visit http://dx.doi.org/10.1111/bph.2011.163.issue-7.


Figures

Figure 1
Figure 1
Three-dimensional model of the CB1 receptor (lime, NewCartoon), based on a sequence alignment with the A2A adenosine receptor (A2AAR) in the activated state (Xu et al., 2011) (PDB code: 3QAK), and embedded within a palmitoyloleoyl-phosphatidylcholine/cholesterol membrane bilayer. In orange, the region of trans-membrane helix 7, containing the CRAC sequence with the relevant residues represented as Van der Waals (VDW) spheres (V392, Y397, K402), is shown. The juxtamembrane C-terminal tail forming helix 8 (yellow) contains the Cys415 residue, represented as VDW spheres together with the bound palmitate molecule. The inset at the bottom shows sequence alignment obtained by ClustalW2 programme of the human CB1, CB2, A2A receptors and the β2-adrenoceptor (β2AR) at the level of helix 8, with the conserved cysteine residues in red. The extracellular loop 2 contains a disulphide bridge between Cys257 and Cys264 (Fay et al., 2005), represented as VDW spheres. The initial 3-D model of CB1 receptors was built using the MODELLER software (Sali and Blundell, 1993) and refined by 40 ns molecular dynamics simulation using the ACEMD software (Harvey et al., 2009) as described earlier (Selent et al., 2010).
Figure 2
Figure 2
Back-repalmitoylation of brain CB1 receptors. Rat brain membrane proteins (10 mg·mL−1) were depalmitoylated by incubating the membranes with 1 M hydroxylamine (30 min at 37°C). Treated and control membranes were washed, and then were incubated with [3H]palmitoyl-CoA (20 µM, 30 min at 37°C). Membranes were CHAPS-solubilized and immunoprecipitated with an anti-CB1 receptor antibody. They were then analysed bySDS-urea-PAGE, and lanes were sliced in 5 mm slices for liquid scintillation counting. The histogram represents the back-palmitoylated cpm obtained from (A) depalmitoylated and (B) control membranes. 1: top of gel; slice 4 coincides with CB1 receptor immunoreactivity. Note differences in Y-axis scale.
Figure 3
Figure 3
Palmitoylation state of human CB1-GFP receptor. CB1-GFP and CB1-(C415A)-GFP were transiently expressed in HEK-293 cells and their palmitoylation state was assessed by the acyl-biotin exchange reaction (see Methods for more details). (A) As control for the levels of the immunoprecipitated receptors, CB1-GFP and CB1-(C415A)-GFP labelled with 1-biotinamido-4-[4′-(maleididomethyl) cyclohexan-ecarboxamido] butane after incubation in the absence (−) or presence (+) of hydroxylamine (NH2OH), was immunodetected with anti-CB1 receptor antibody (anti-CB1). (B) Biotin-labelled receptors (i.e. palmitoylated receptors) were visualized by probing the same membrane (after stripping) with streptavidin-HRP. Results are representative of two independent experiments.
Figure 4
Figure 4
Evaluation of the expression efficiency of CB1-GFP and CB1(C415A)-GFP receptors. (A) CB1-GFP or CB1(C415A)-GFP expression vectors were transiently transfected into SH-SY5Y cells, and their expression levels were analysed by Western blotting of whole cell lysates using an anti-CB1 receptor antibody. (B) Histogram plots showing green fluorescence exhibited by SH-SY5Y cells transfected by the same constructs. Twenty-four hours after transfection, cells were trypsinized and analysed for GFP expression by FACS. More details are given under Methods. Results are expressed as mean ± SEM and are representative of two independent experiments.
Figure 5
Figure 5
Membrane targeting of CB1-GFP and CB1(C415A)-GFP receptors. Details are given under Methods, and numerical values are summarized in Table 1. (A–F) Double staining of SH-SY5Y cells expressing CB1-GFP (A) and CB1(C415A)-GFP (D) receptors together with DiIC16 (B and E) for plasma membrane staining. Merged images are shown in the panels C and F. Scale bars, 10 µm. Images are representative of three independent experiments, for a total of 18–27 cells. (G and H) Graphs showing the overlap coefficient (i.e. the degree of overlap between DiIC16 and GFP-tagged receptors fluorescence, as described under Methods) versus the mean green fluorescence intensity (i.e. a measure of CB1-GFP [G] and CB1[C415A]-GFP [H] expression in each cell) for 100 transfected cells. The overlap coefficient and the expression level were not correlated for either receptor (R2 < 0.005). (I and J) Detection of surface expression of CB1 receptors by FACS. GFP-transfected cells and cells overexpressing wild-type (G) and mutant (H) CB1 receptors were incubated with anti-CB1 PA1-745, and were analysed by indirect immunofluorescence using allophycocyanin-labelled secondary antibody. The red fluorescence analysis was performed only on the GFP-positive fraction. The displayed patterns are representative of three independent experiments. (K) Mean red fluorescence obtained for the wild-type and mutant CB1 receptors. The mean red fluorescence was calculated within the gates shown in panels G and H. A typical experiment out of the three performed independently is represented. **P < 0.01 versus CB1-GFP receptor.
Figure 6
Figure 6
Confocal microscopy analysis of raft targeting of CB1-GFP and CB1(C415A)-GFP receptors in SH-SY5Y cells. Details are as given under Methods and numerical values are summarized in Table 1. Images are representative of three independent experiments for a total of 18–27 cells. (A) Triton X-100 (TX-100) extraction assay. CB1-GFP and CB1(C415A)-GFP transfected cells were imaged before (top panels) and after (bottom panels) detergent incubation. Scale bars, 10 µm. (B) Triton X-100 extracted cells expressing both receptors were double-stained with DiIC16. Scale bars, 10 µm. (C) Co-localization analysis of the distribution of CB receptors and cholera toxin B (CTB) in Triton X-100 extracted cells. Merged images are shown in the bottom panels. Scale bars, 2 µm.
Figure 7
Figure 7
Diffusional mobility of CB1-GFP and CB1(C415A)-GFP receptors in the plasma membrane measured by confocal FRAP. Details are given under Methods and derived values are summarized in Table 1. Recovery curves from plasma-associated pools of CB1-GFP and CB1(C415A)-GFP receptors transiently transfected in SH-SY5Y. Data show the mean ± S.E.M for 9 cells and are from a representative experiment (out of three independent experiments).
Figure 8
Figure 8
Function of CB1-GFP and CB1(C415A)-GFP receptors in HEK-293 cells. CB1-GFP or CB1(C415)-GFP were transiently transfected into HEK-293 cells and their function was tested. Details are given under Methods, and numerical values are summarized in Table 2. (A) Saturation binding curves for the CB1 receptor agonist [3H]CP55940 on plasma membrane preparations from cells expressing CB1-GFP and CB1(C415)-GFP receptors. Membranes were incubated with different concentrations of [3H]CP55940 at 37°C for 60 min. (B) Stimulation of [35S]GTPγS binding by CP55940 in whole cells expressing CB1-GFP and CB1(C415A)-GFP receptors. Values are mean (±SEM) percentage of maximal wild-type stimulation (18000 ± 3000 cpm), from at least three independent experiments, each performed in triplicate. (C) Dose-dependence of cAMP biosynthesis in cells over-expressing the CB1-GFP and CB1(C415A)-GFP receptors. Cells were incubated with 0.45 µM forskolin and varying concentrations of CP55940, as described in Methods. Values are mean (±SEM) percentage of maximal level of cAMP in cells with mutant receptors (3.8 ± 0.2 pmol per 104 cells), from at least three independent experiments, each performed in triplicate.
Figure 9
Figure 9
Effect of depalmitoylation on CB1 receptor association with Gα proteins in N18TG2 cells or in rat forebrain membranes. Details are given under Methods. After each treatment, P2 membrane fractions were immunoprecipitated with CB1 receptor antibodies, and Western blots were performed after SDS-urea-10% PAGE, with detection by N-terminal CB1 receptor antibody and anti-Gαi2, Gαi3 or Gαo specific antibodies, as indicated. Blots are representative of three independent experiments.

References

    1. Ahn KH, Nishiyama A, Mierke DF, Kendall DA. Hydrophobic residues in helix 8 of cannabinoid receptor 1 are critical for structural and functional properties. Biochemistry. 2010;49:502–511. - PMC - PubMed
    1. Alexander SPH, Mathie A, Peters JA. Guide to Receptors and Channels (GRAC), 5th Edition. Br J Pharmacol. 2011;164(Suppl. 1):S1–S324. - PMC - PubMed
    1. Anderson RG, Jacobson K. A role for lipid shells in targetinG-proteins to caveolae, rafts, and other lipid domains. Science. 2002;296:1821–1825. - PubMed
    1. Bari M, Battista N, Fezza F, Finazzi-Agrò A, Maccarrone M. Lipid rafts control signaling of type-1 cannabinoid receptors in neuronal cells. Implications for anandamide-induced apoptosis. J Biol Chem. 2005;280:12212–12220. - PubMed
    1. Bari M, Oddi S, De Simone C, Spagnolo P, Gasperi V, Battista N, et al. Type-1 cannabinoid receptors colocalize with caveolin-1 in neuronal cells. Neuropharmacology. 2008;54:45–50. - PMC - PubMed

Publication types