. 2011 Dec;20(6):687-99.
doi: 10.1111/j.1365-2583.2011.01097.x. Epub 2011 Sep 7.

Brief exposures of human body lice to sublethal amounts of ivermectin over-transcribes detoxification genes involved in tolerance

Affiliations

Brief exposures of human body lice to sublethal amounts of ivermectin over-transcribes detoxification genes involved in tolerance

K S Yoon et al. Insect Mol Biol. 2011 Dec.

Abstract

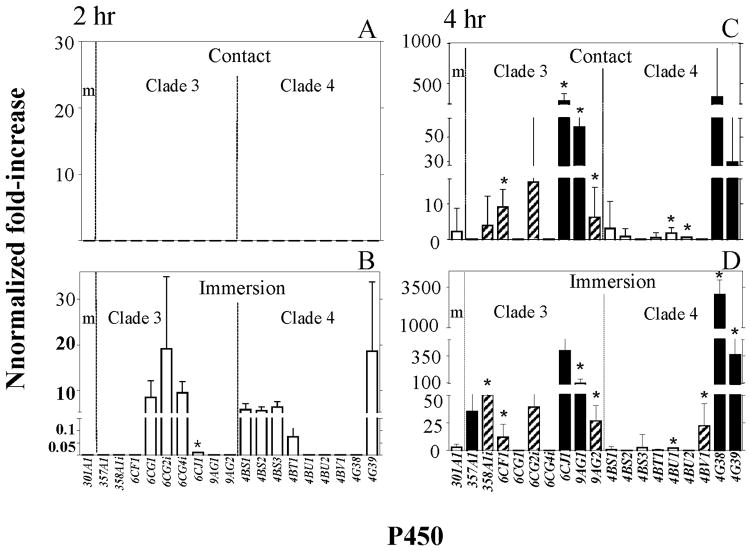
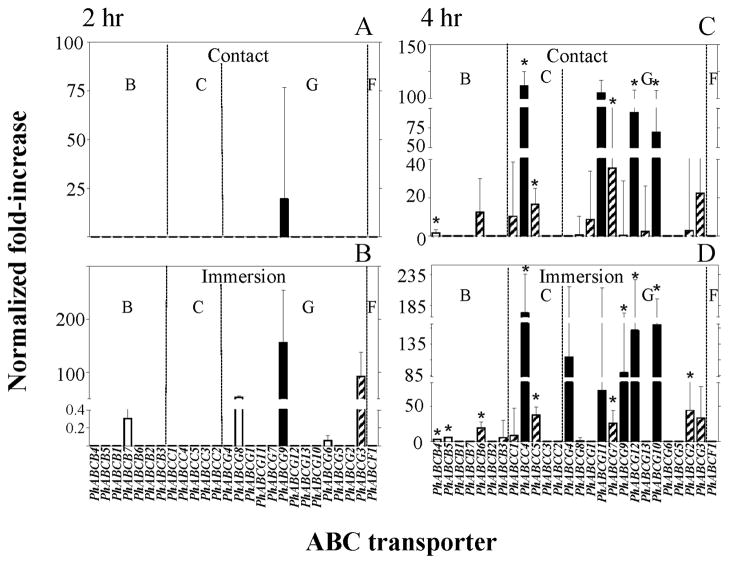
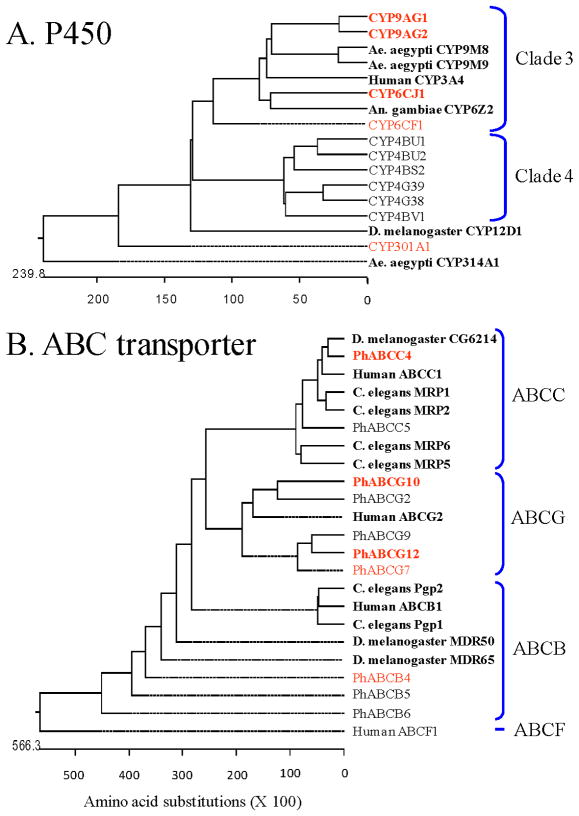
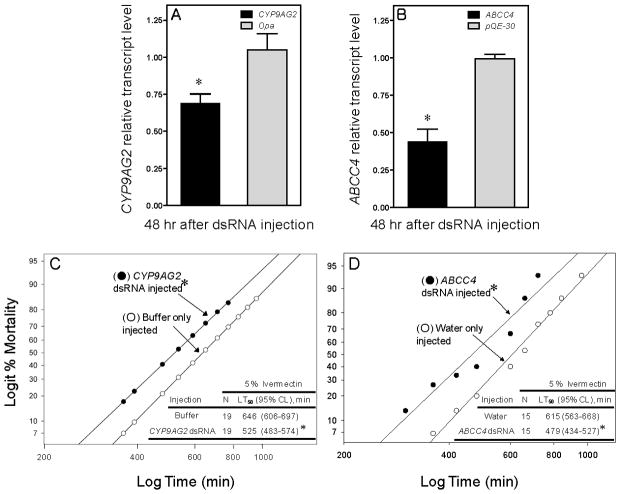
Transcriptional profiling results, using our non-invasive induction assay {short exposure intervals (2-5 h) to sublethal amounts of insecticides [< lethal concentration 3% (LC(3)) at 24 h] administered by stress-reducing means (contact vs. immersion screen) and with induction assessed in a time frame when tolerance is still present [~lethal concentration 90% (LC(90)) in 2-4 h]}, showed that ivermectin-induced detoxification genes from body lice are identified by quantitative real-time PCR analyses. Of the cytochrome P450 monooxygenase and ATP binding cassette transporter genes induced by ivermectin, CYP6CJ1, CYP9AG1, CYP9AG2 and PhABCC4 were respectively most significantly over-expressed, had high basal expression levels and were most closely related to genes from other organisms that metabolized insecticides, including ivermectin. Injection of double-stranded RNAs (dsRNAs) against either CYP9AG2 or PhABCC4 into non-induced female lice reduced their respective transcript level and resulted in increased sensitivity to ivermectin, indicating that these two genes are involved in the xenobiotic metabolism of ivermectin and in the production of tolerance.


Figures

Figure 1
Figure 1
Log time versus logit mortality regression analyses of a lethal contact concentration of 1 % (w/v) ivermectin (IVM) using female body lice pretreated by immersion with either a sub-lethal concentration of verapamil (VRP; 1 %, w/v) or dexamethasone (DEX; 1 %, w/v) in ethanol. Asterisks (*) indicate that pretreated regressions are significantly different from ethanol (EtOH)-treated control regressions using the maximum log-likelihood ratio test (P<0.05). Synergistic ratios (SR) are determined by dividing the pretreatment LT50 values (VRP or DEX) by the ethanol-only LT50 value (EtOH).
Figure 2
Figure 2
Comparative tolerance to lethal contact concentrations of ivermectin (1 %, w/v, IVM in panel A or 5 %, w/v, IVM in panel B) using female body lice pretreated by immersion with a sub-lethal concentration of ivermectin (10−9 M) in ethanol. Asterisks (*) indicate that pretreated regressions are significantly different from ethanol (EtOH)-treated control regressions using the maximum log-likelihood ratio test (P<0.05). Induction ratios (IR) for tolerance are determined by dividing the IVM pretreatment LT50 values by the ethanol-only LT50 value (EtOH).
Figure 3
Figure 3
Relative increases in the transcript levels of cytochrome P450 monooxygenase (P450) genes determined by qPCR following 2 (panels A and B) and 4 (panels C and D) h post ivermectin (IVM) treatments of female lice, where normalized fold-increase = normalized basal transcript level × [relative fold-increase of transcript level following IVM treatment (10−6 M for direct contact (panels A and C); 10−9 M IVM in ethanol for immersion (panels B and D)) − 1]. Asterisks (*) indicate a significant increase in transcript levels over respective controls using Student’s t-test (P<0.05). Solid bars are highly expressed (normalized basal level transcription (NBLT > 220), hatched bars are modestly expressed 30 < NBLT < 220) and open bars are weakly expressed (NBLT < 30) genes.
Figure 4
Figure 4
Relative increases in the transcript levels of ABC transporter genes determined by qPCR following 2 (panels A and B) and 4 (panels C and D) h post ivermectin (IVM) treatments of female lice, where normalized fold-increase = normalized basal transcript level × [relative fold-increase of transcript level following IVM treatment (10−6 M for contact (panels A and C); 10−9 M IVM for immersion (panels B and D)) − 1]. Asterisks (*) indicate a significant increase in transcript levels over respective controls using Student’s t-test (P<0.05). Solid bars are highly expressed (normalized basal level transcription (NBLT > 220), hatched bars are modestly expressed 30 < NBLT < 220) and open bars are weakly expressed (NBLT < 30) genes. The letters B, C, G, and F designate ABC transporter subfamilies.
Figure 5
Figure 5
Phylogenetic trees of cytochrome P450 monooxygenases (P450) and ABC transporters from deduced amino acid sequences of genes from female body lice that were significantly induced following a brief exposure to a sub-lethal amount of ivermectin. Louse genes over-transcribed following both immersion and contact exposures and that are highly expressed are given in bold red font. Louse genes over-transcribed following both immersion and contact exposures that are modestly expressed are given in normal red font. Louse genes that were over-transcribed by only one of the two exposure means and/or were either modestly or weakly expressed are given in normal black font. Non-louse genes used for comparisons are given in bold black font with the organism’s name.
Figure 6
Figure 6
Relative transcript levels (panel A and B) and mortality responses (panel C and D) of body louse females to a lethal contact amount of ivermectin (5% IVM) following injection of dsRNA targeting either louse CYP9AG2 or ABCC4. Lice were also injected with either dsRNA of the odd-paired gene, opa, (GeneBank accession # S78339) for P450 silencing or with dsRNA of the E.coli plasmid, pQE30, for ABC transporter silencing as sham injected controls. Asterisks (*) in panels A and B indicate that CYP9AG2 and ABCC4 dsRNA significantly suppress the levels of CYP9AG2 and ABCC4 transcripts, respectively (Student’s t-test, P<0.05). In panel C, the bioassay was started 48 hr after CYP9AG2 dsRNA injection. In panel D, the bioassay was started 12 hr after ABCC4 dsRNA injection. Asterisks (*) in panels C and D indicate that the mortality responses of lice injected with dsRNAs were significantly different from their respective controls (buffer or water only injected, maximum log-likelihood ratio test, P<0.05).

References

    1. Agarwala S, Chen W, Cook TJ. Effect of chlorpyrifos on efflux transporter gene expression and function in Caco-2 cells. Toxicol In Vitro. 2004;18:403–409. - PubMed
    1. Baek JH, Clark JM, Lee SH. Cross-strain comparison of cypermethrin-induced cytochrome P450 transcription under different induction conditions in diamondback moth. Pestic Biochem Physiol. 2010;96:43–50.
    1. Brandt A, Scharf M, Pedra JHF, Holmes G, Dean A, Kreitman M, Pittendrigh BR. Differential expression and induction of two Drosophila cytochrome P450 genes near the Rst (2) locus. Insect Mol Biol. 2002;11:337–341. - PubMed
    1. Brouqui P, Lascola B, Roux V, Raoult D. Chronic Bartonella quintana bacteremia in homeless patients. The New England J of Med. 1999;340:184–189. - PubMed
    1. Carton Y, Frey F, Stanley DW, Vass E, Nappi A. Dexamethasone inhibition of the cellular response of Drosophila melanogaster against a parasitoid. J Parasit. 2002;88:405–407. - PubMed

Publication types

MeSH terms