. 2011 Dec;10(6):996-1010.
doi: 10.1111/j.1474-9726.2011.00740.x. Epub 2011 Oct 12.

Ablation of ghrelin receptor reduces adiposity and improves insulin sensitivity during aging by regulating fat metabolism in white and brown adipose tissues

Affiliations

Ablation of ghrelin receptor reduces adiposity and improves insulin sensitivity during aging by regulating fat metabolism in white and brown adipose tissues

Ligen Lin et al. Aging Cell. 2011 Dec.

Abstract

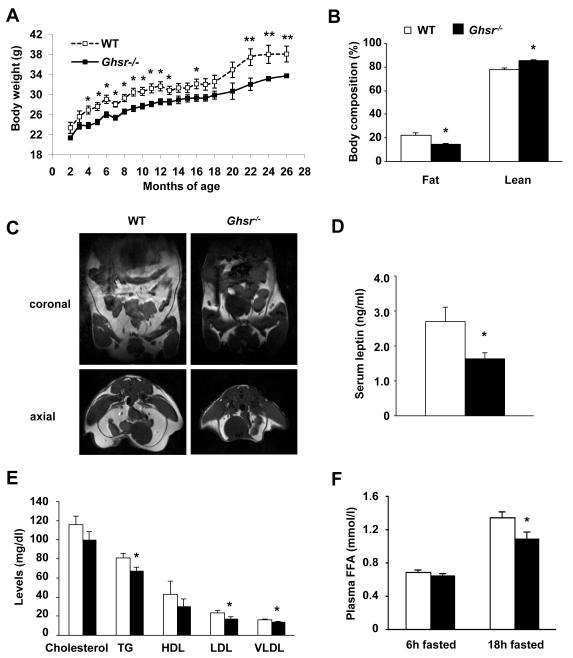
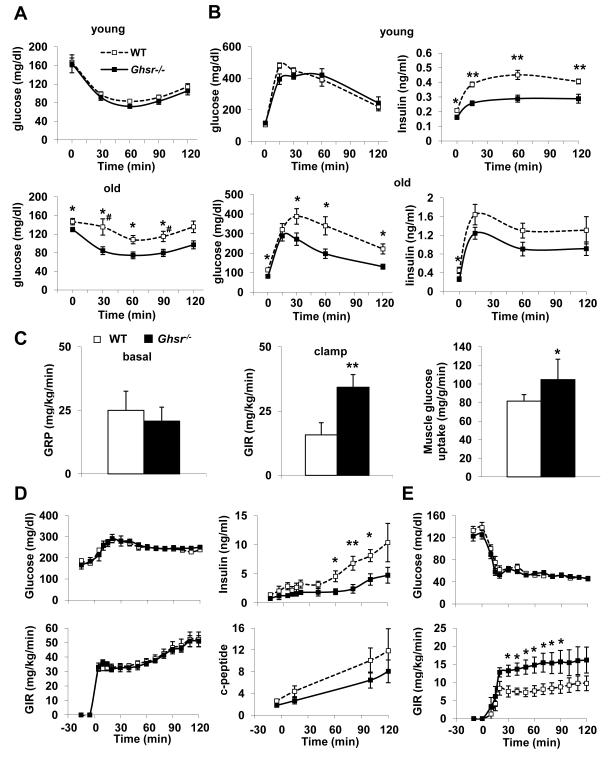
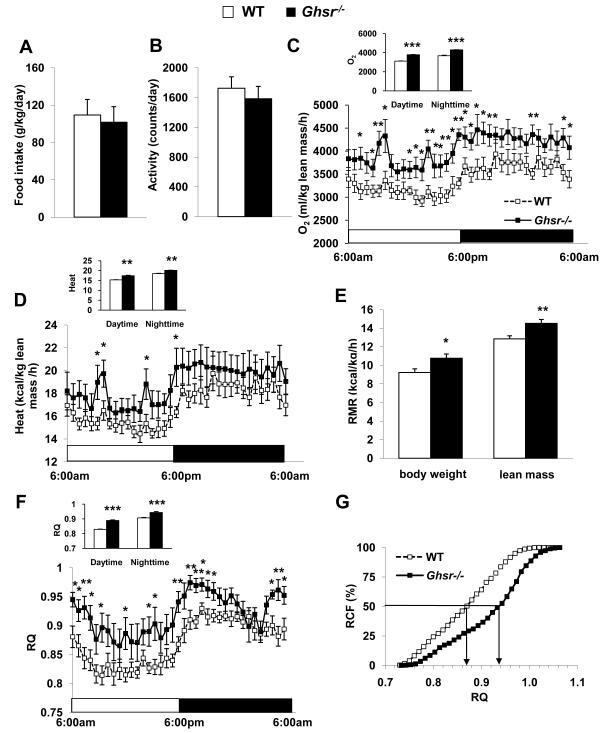
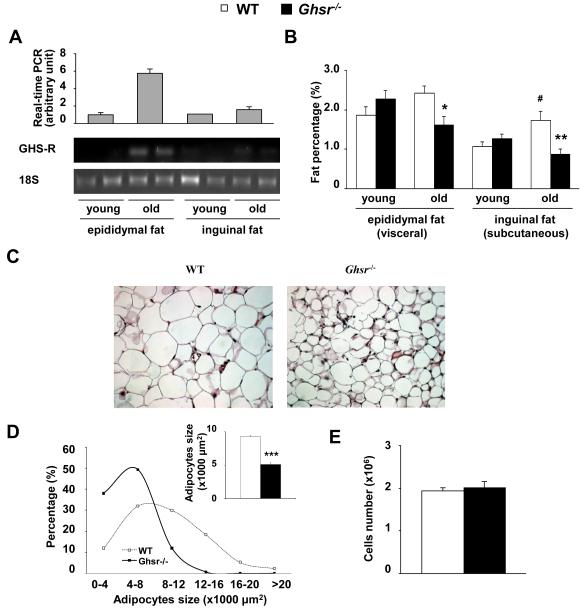
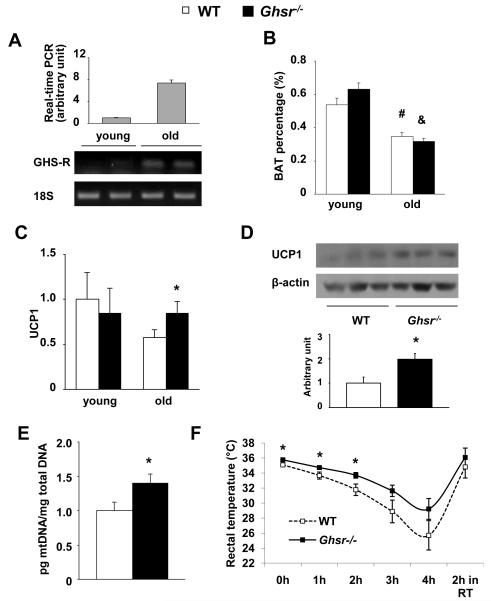
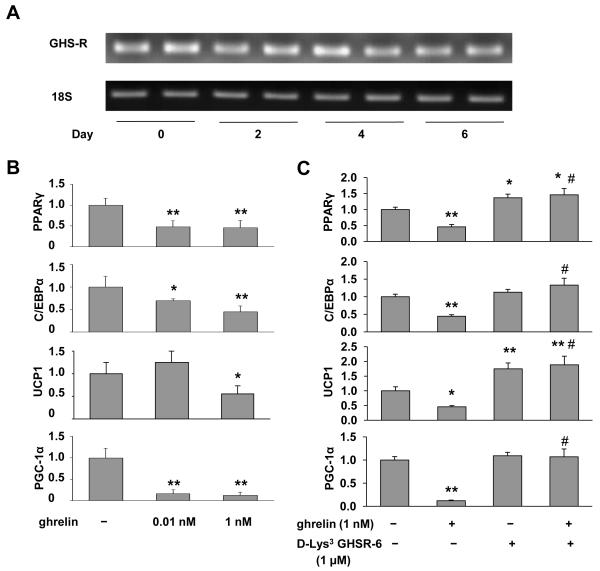
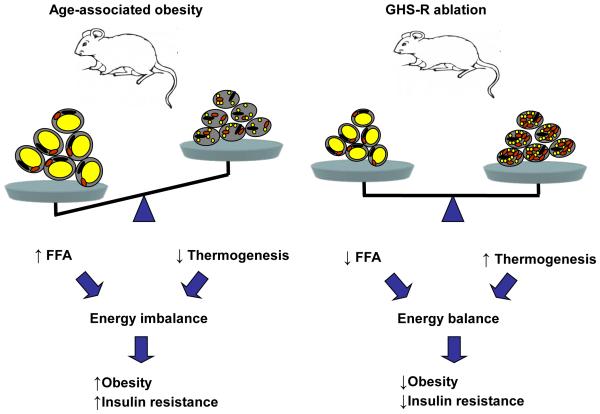
Aging is associated with increased adiposity in white adipose tissues and impaired thermogenesis in brown adipose tissues; both contribute to increased incidences of obesity and type 2 diabetes. Ghrelin is the only known circulating orexigenic hormone that promotes adiposity. In this study, we show that ablation of the ghrelin receptor (growth hormone secretagogue receptor, GHS-R) improves insulin sensitivity during aging. Compared to wild-type (WT) mice, old Ghsr(-/-) mice have reduced fat and preserve a healthier lipid profile. Old Ghsr(-/-) mice also exhibit elevated energy expenditure and resting metabolic rate, yet have similar food intake and locomotor activity. While GHS-R expression in white and brown adipose tissues was below the detectable level in the young mice, GHS-R expression was readily detectable in visceral white fat and interscapular brown fat of the old mice. Gene expression profiles reveal that Ghsr ablation reduced glucose/lipid uptake and lipogenesis in white adipose tissues but increased thermogenic capacity in brown adipose tissues. Ghsr ablation prevents age-associated decline in thermogenic gene expression of uncoupling protein 1 (UCP1). Cell culture studies in brown adipocytes further demonstrate that ghrelin suppresses the expression of adipogenic and thermogenic genes, while GHS-R antagonist abolishes ghrelin's effects and increases UCP1 expression. Hence, GHS-R plays an important role in thermogenic impairment during aging. Ghsr ablation improves aging-associated obesity and insulin resistance by reducing adiposity and increasing thermogenesis. Growth hormone secretagogue receptor antagonists may be a new means of combating obesity by shifting the energy balance from obesogenesis to thermogenesis.


Figures

Fig. 1
Fig. 1. GHS-R null mice display reduced adiposity and improved lipid profile
(A) Body weights of WT and Ghsr−/− mice from 2- to 26-months. n = 8-15. (B) PIXImus scan analyses revealed that the 18-month old Ghsr−/− mice have less fat mass and more lean mass than those of WT mice (percentage of body weight). n = 8. (C) Proton density-weighted axial MRI images of 24-month old WT and Ghsr−/− mice in both coronal and axial sections. White areas denote fat. (D) Serum leptin level in 18-month old WT and Ghsr−/− mice after overnight fasting. n = 6. (E) Plasma cholesterol, triglycerides, HDL, LDL, and VLDL levels in 16-month old WT and Ghsr−/− mice after 24h fasting. n = 9. (F) Plasma free fatty acid levels of 18-month old WT and Ghsr−/− mice in the 4h and 18h fasted states. n = 9. *, p < 0.05, **, p < 0.01, WT vs. Ghsr−/− mice.
Figure 2
Figure 2. GHS-R null mice have improved age-associated insulin resistance
(A) Insulin tolerance tests of young (top panel, 4-month old) and old (bottom panel, 20-month old) WT and Ghsr−/− mice. n = 9. # indicates that when the glucose levels at 30 min and 90 min time points are calculated as percentage of baseline values (Fig. S2.A), the difference between WT and Ghsr−/− mice is still significantly different, p < 0.05. (B) Glucose tolerance test of young (top panel, 4-month old) and old (bottom panel, 20-month old) WT and Ghsr−/− mice. On the left is glucose, and on the right is insulin. n = 8. (C) Hyperinsulinemic-euglycemic clamp of 3-month old WT and Ghsr−/− mice. Basal glucose production is shown on the left, whole-body glucose infusion rates (GIR) during hyperinsulinemic-euglycemic clamp are shown in the middle, and muscle glucose uptake is shown on the right. n = 6. (D) Hyperglycemic clamp of 18-month old WT and Ghsr−/− mice. Glucose infusion rate is shown on the left, insulin and c-peptide levels are shown on the right. n = 10-11. (E) Hypoglycemic clamp of 18-month old WT and Ghsr−/− mice. Glucose infusion rate is shown on the bottom. n = 10. *, p < 0.05, **, p < 0.01, WT vs. Ghsr−/− mice.
Figure 3
Figure 3. GHS-R null mice have increased energy expenditure and improved metabolic flexibility
22-month old WT and Ghsr−/− mice were used. (A) Daily food intake during calorimetry. (B) Total locomotor activity during calorimetry. (C) Oxygen consumption (VO2), normalized with lean mass and average values of oxygen consumption during light and dark cycles (inserts). (D) Energy expenditure normalized with lean mass. (E) Resting metabolic rate (RMR) was measured during light cycle, and normalized with both body weight and lean mass, respectively. (F) Respiratory quotient (RQ) and average of RQ (inserts) during light and dark cycles. (G) Relative cumulative frequency (RCF). n = 8 for all experiments A through G. *, p < 0.05, **, p < 0.01 ***, p < 0.001, WT vs. Ghsr−/− mice.
Figure 4
Figure 4. GHS-R null mice have reduced adipocyte cell size
4-month young and 22-month old WT and Ghsr−/− mice were used. (A) GHS-R expression levels in WAT (epididymal and inguinal fat) were evaluated using real-time RT-PCR (top) and semi-quantitative RT-PCR (bottom). (B) White adipose tissue (epididymal and inguinal fat) weight. n = 8, *, p < 0.05, **, p < 0.01 to compare WT vs. Ghsr−/− mice. #, p < 0.05 to compare young vs old WT. (C) Epididymal adipocyte morphology (Representative H&E sections). (D) The distribution of adipocyte cell size. Insert: average size of the adipocytes of WT and Ghsr−/− mice. n = 7, ***, p < 0.001, WT vs. Ghsr−/− mice. (E) Cell numbers of whole-piece epididymal fat from WT and Ghsr−/− mice were determined by lipid content. n = 4.
Figure 5
Figure 5. GHS-R is expressed in BAT of old mice and GHS-R ablation prevents against age-associated decline of thermogenic function
4-month young and 22-month old WT and Ghsr−/− mice were used. (A) GHS-R expression levels in BAT of young and old WT were evaluated using real time RT-PCR (top) semi-quantitative RT-PCR (bottom). (B) Brown adipose tissue weight, of young and old WT and Ghsr−/−mice. n = 8, #, p < 0.01 between young vs. old WT mice; &, p < 0.01 between young vs. old Ghsr−/− mice. (C) UCP1 mRNA levels in BAT of young and old WT and Ghsr−/− mice. n = 9. (D) UCP1 protein levels in BAT of 22-month old WT and Ghsr−/− mice. Top panel is the representative Western blots and bottom panel is the quantization of the Westerns. (E) Mitochondrial density was evaluated by the ratio of mitochondrial DNA(pg)/total nuclear DNA(mg) in BAT of 22-month old WT and Ghsr−/− mice. n = 6. (F) Rectal temperature of 18- to 20-month old WT and Ghsr−/− mice: mice were fasted overnight in normal housing facility, then moved to 4°C cold room for 4 hours. The temperature was sampled every hour, and after 2 hour recovery in room temperature. n = 12. *, p < 0.05., WT vs. Ghsr−/− mice.
Figure 6
Figure 6. Ghrelin regulates brown adipocyte differentiation and UCP1 expression in HIB1B cells through GHS-R
(A) GHS-R expression in HIB1B cells during differentiation was detected with semi-quantitative RT-PCR. (B) Real-time RT-PCR analyses of PPARγ, C/EBPα, UCP1 and PGC-1α expression in differentiated HIB1B cells treated with saline or ghrelin *, p < 0.05, **, p < 0.01, Treatments vs. Controls. (C) Real-time RT-PCR analysis of PPARγ, C/EBPα, UCP1 and PGC-1α mRNA levels in differentiated HIB1B cells treated with saline, 1 nM ghrelin, 1 μM [D-Lys3]-GHRP-6 or combination of ghrelin and [D-Lys3]-GHRP-6. *, p < 0.05, **, p < 0.01, Treatments vs. Controls. #, p < 0.01, Ghrelin and [D-Lys3]-GHRP-6 combination treatment vs. Ghrelin treatment. n = 9, and each assay was measured in triplicate.
Figure 7
Figure 7. The schematic diagram of the role of GHS-R ablation in fat metabolism during aging
Data summary and interpretation: Aging is associated with increased adiposity and impaired thermogenesis, which results in energy imbalance and subsequently leads to obesity and insulin resistance (left panel). GHS-R ablation reduces adiposity in white adipose tissues and increases thermogenesis in brown adipose tissues. This allows the animals to maintain an energy balanced state, subsequently leading to reduced obesity and improved insulin sensitivity (right panel).

Similar articles

Cited by

References

    1. Ahima RS. Connecting obesity, aging and diabetes. Nat Med. 2009;15:996–997. - PubMed
    1. Amati F, Dube JJ, Coen PM, Stefanovic-Racic M, Toledo FG, Goodpaster BH. Physical inactivity and obesity underlie the insulin resistance of aging. Diabetes Care. 2009;32:1547–1549. - PMC - PubMed
    1. Andrews ZB, Liu ZW, Walllingford N, Erion DM, Borok E, Friedman JM, Tschop MH, Shanabrough M, Cline G, Shulman GI, Coppola A, Gao XB, Horvath TL, Diano S. UCP2 mediates ghrelin’s action on NPY/AgRP neurons by lowering free radicals. Nature. 2008;454:846–851. - PMC - PubMed
    1. Barzilai N, Banerjee S, Hawkins M, Chen W, Rossetti L. Caloric restriction reverses hepatic insulin resistance in aging rats by decreasing visceral fat. J Clin Invest. 1998;101:1353–1361. - PMC - PubMed
    1. Barzilai N, Gabriely I. The role of fat depletion in the biological benefits of caloric restriction. J Nutr. 2001;131:903S–906S. - PubMed

Publication types

MeSH terms