. 2011 Oct;134(2):185-97.
doi: 10.1111/j.1365-2567.2011.03478.x.

Leukotriene C(4) prevents the complete maturation of murine dendritic cells and modifies interleukin-12/interleukin-23 balance

Affiliations

Leukotriene C(4) prevents the complete maturation of murine dendritic cells and modifies interleukin-12/interleukin-23 balance

Carolina Alvarez et al. Immunology. 2011 Oct.

Abstract

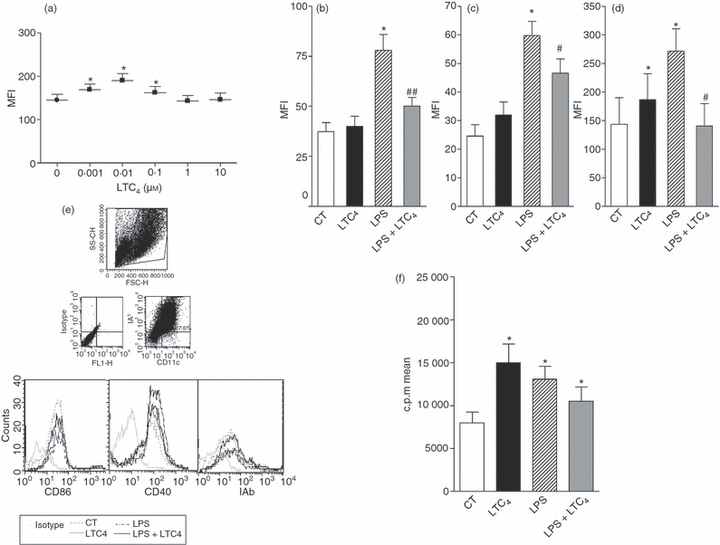
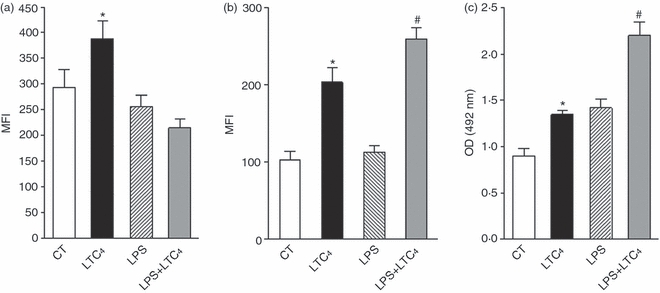
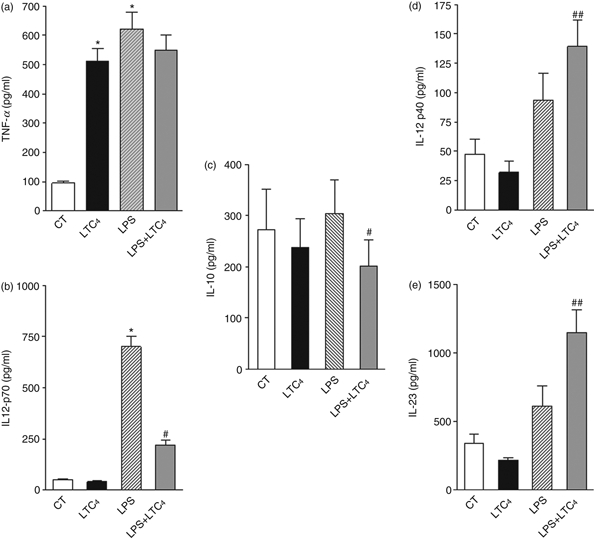
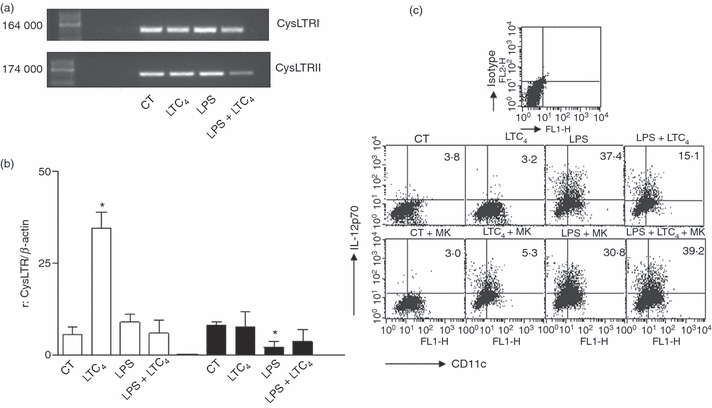
Leukotriene C(4) is an important mediator in the development of inflammatory reactions and ischaemia. Previous studies have shown that leukotriene C(4) is able to modulate the function of dendritic cells (DCs) and induce their chemotaxis from skin to lymph node. In this study, we decided to evaluate the modulation exerted by leukotriene C(4) on DCs, depending on their status of activation. We showed for the first time that leukotriene C(4) stimulates endocytosis both in immature and lipopolysaccharide (LPS) -activated DCs. Moreover, it suppressed the interleukin-12p70 (IL-12p70) release, but induces the secretion of IL-23 by DCs activated with LPS and promotes the expansion of T helper type 17 (Th17) lymphocytes. Furthermore, blocking the release of IL-23 reduced the percentages of CD4(+) T cells producing IL-17 in a mixed lymphocyte reaction. Ours results suggest that leukotriene C(4) interferes with the complete maturation of inflammatory DCs in terms of phenotype and antigen uptake, while favouring the release of IL-23, the main cytokine involved in the maintenance of the Th17 profile.


Figures

Figure 1
Figure 1
Leukotriene C4 (LTC4) inhibits CD86 and MHC class II expression on lipopolysaccharide (LPS) -matured dendritic cells (DCs). (a) DCs (1.5 × 10⁶/ml) were cultured for 18 hr at 37° with different concentrations of LTC4. Then, MHC class II molecule expression was analysed by flow cytometry. (b,c,d) CD40; CD86 and MHC class II expression, DCs were evaluated after the incubation for 30 min at 37° in presence (LPS) or not (Ct) of LPS (1 μg/ml). Finally, cells were incubated overnight at 37° with or without LTC4 (0.01 μm). (e) Representative histograms of six or seven experiments, for MHC class II, CD40 and CD86 molecules, respectively. Results are expressed as mean fluorescence intensity (MFI) and represent the arithmetic mean ± SEM of six or seven experiments. (f) DCs (1.5 × 10⁶/ml) were cultured with or without LPS (1 μg/ml) for 30 min at 37°, finally cells were treated or not with LTC4 (0.01 μm, 30 min at 37°). Then, DCs were washed and co-cultured with freshly isolated allogeneic splenocytes for 5 days at a ratio 1 : 10. Thymidine incorporation was measured on day 5 by a 16-hr pulse with [3H]thymidine (1 μCi/well). Results are the mean ± SEM of five experiments. Asterisk represents statistical significance (*P < 0.05) versus CT; and # represents significance (#P ≤ 0.05; ##P ≤ 0.01) versus LPS.
Figure 2
Figure 2
Leukotriene C4 (LTC4) differentially stimulates antigen-uptake in immature and mature dendritic cells (DCs). (a,b) The DCs (1.5 × 10⁶/ml) were cultured for 30 min at 37° with or without lipopolysaccharide (LPS; 1 μg/ml), then cells were stimulated in the presence or not of 0.01 μm LTC4 for 30 min at 37°. Then, cells were incubated with Zy-FITC (a) for 40 min at room temperature or DX-FITC (b) (100 μg/ml) for 1 hr at 37°, and antigen uptake was measured by flow cytometry. Results are expressed as mean fluorescence intensity (MFI) and represent the arithmetic mean ± SEM of six experiments. In (c), DCs or LPS-treated DCs (1.5 × 10⁶/ml) were cultured with or without LTC4 (0.01 μm) for 30 min at 37°. Then, HRP (150 μg/ml) was added and the HRP uptake by DCs was evaluated as described in the Materials and methods. Results are expressed as optical density (OD) at 492 nm and represent the arithmetic mean ± SEM of five experiments. The results are expressed as MFI or OD and represent the arithmetic mean ± SEM of five or six experiments. Asterisk represents statistical significance (*P ≤ 0.05) versus controls and # represents significance (#P ≤ 0.05) versus LPS.
Figure 3
Figure 3
Leukotriene C4 (LTC4) inhibits the T helper type 1 (Th1) profile by lipopolysaccharide (LPS) matured dendritic cells (DCs). The DCs were incubated for 30 min in the presence (LPS, 1 μg/ml) or absence (CT) of LPS at 37°. After washing, DCs were treated with or without 0.01 μm LTC4 at 37°, overnight, Then we collected the supernatants and we quantified the levels of tumour necrosis factor-α (TNF-α) (a), interleukin-12p70 (IL-12p70) (b), IL-10 (c), IL-12p40 (d) and IL-23 (e) by ELISA. Bars represent the cytokine concentrations (pg/ml) and represent the mean ± SEM of six experiments. Asterisk represents statistical significance (*P ≤ 0.05) versus CT and # represents significance (#P ≤ 0.05; ##P ≤ 0.01) versus LPS.
Figure 4
Figure 4
Immature and mature dendritic cells (DCs) express cysteinyl leukotriene receptors 1 (CysLTR1) and CysLTR2. The expression of CysLTR1 and CysLTR2 was evaluated by RT-PCR. RNAs from immature and lipopolysaccharide (LPS) -stimulated DCs, were extracted after 18 hr of culture in the presence or absence of leukotriene C4 (LTC4; 0.01 μm). RNAs used as positive controls were from lung to the CysLTR1 and tissues of intestinal mucosa to the CysLTR2. (a) Representative gels of RT-PCR from six independent experiments are shown. (b) Shows the histogram bars for the ratio values obtained from the normalization of the diameters of each band compared with β-actin. The results are expressed as ratio and represent the arithmetic mean ± SEM of six experiments. Asterisk represents statistical significance (*P ≤ 0.05) versus controls. (b) DCs and lipopolysaccharide (LPS) -stimulated DCs (1 μg/ml for 30 min at 37°) were incubated (1 × 10⁶ cells/ml) for 20 min at 37° without or with 1 μm montelukast. Then, DCs were untreated or treated with LTC4 (0.01 μm) for 18 hr at 37°. Brefeldin A (5 μg/ml) was added during the last 6 hr of culture to inhibit the release of cytokines into the supernatant. Finally, the percentages of interleukin-12p70-positive cells were evaluated by intracytoplasmic staining. We showed a representative dot plot obtained by cytometry.
Figure 5
Figure 5
Leukotriene C4 (LTC4) activates ERK1/2 and p38 MAPK in dendritic cells (DCs). (a) DCs (3 × 10⁶ cells per 500 μl complete medium) were prewarmed for 30 min at 37°. Cells were incubated in the presence or absence of LPS (1 μg/ml) for 30 min at 37° and then treated or not with 0.01 μm LTC4 for 5 min at 37°. The samples were analysed by Western blotting as described in the Materials and methods. Pervanadate-treated DCs (0.1 mm orthovanadate plus 0.3 mm H2O2 for 10 min at 37°) were used as positive phosphorylation controls. Western blots are representative of five experiments. (b) and (c) Histograms of ratio obtained by quantitative densitometric analysis of P-p38 and ERK1/2; respectively, normalized with β-actin densitometric units. The bars represent the mean ± SEM of five experiments. Asterisk represents statistical significance (*P ≤ 0.05) versus CT and # represents significance (#P ≤ 0.05) versus LPS.
Figure 6
Figure 6
p38 MAPK is involved in regulating endocytosis by leukotriene C4 (LTC4) on lipopolysaccharide (LPS) -stimulated dendritic cells (DCs). The DCs and LPS-stimulated DCs (1 μg/ml for 30 min at 37°) were incubated (2.5 × 10⁶ cells/ml) for 20 min at 37° without inhibitors or in the presence of 50 μm SB202190. Then, the cells were exposed to LTC4 (0.01 μm) for 30 min at 37°. After this time, DCs were washed and cultured for an additional 40 min in the presence of dextran (DX) -FITC (100 μg/ml) at 37°. (a) Results are expressed as mean fluorescence intensity (MFI) and represent the arithmetic mean ± SEM of four experiments. (b,c) and (d) DCs and LPS-stimulated DCs (1 μg/ml for 30 min at 37°) were incubated (2.5 × 10⁶ cells/ml) for 20 min at 37° without inhibitors or in the presence of 50 μm PD98059 or 50 μm SB202190. Then, DCs were untreated or treated with LTC4 (0.01 μm) for 18 hr at 37°, in some cases, brefeldin A (5 μg/ml) was added during the last 6 hr of culture to inhibit the release of cytokines into the supernatant. (b) Culture supernatants were collected and levels of interleukin-23 (IL-23) were quantified by ELISA. Results are expressed as the cytokine concentrations (pg/ml) and represent the mean ± SEM of four experiments. The percentages of positive cells for IL-12p70 (c) and IL-12p40 (d) are shown and represent the arithmetic mean ± SEM of three experiments. Asterisk represents statistical significance *P< 0.05 for DCs pretreated or not with inhibitors and then exposed to LTC4.
Figure 7
Figure 7
Leukotriene C4 (LTC4) induces the genesis of a T helper type 17 (Th17) profile by lipopolysaccharide (LPS) -stimulated dendritic cells (DCs). DCs obtained from C57BL/6 mice were incubated for 30 min in the presence (LPS, 1 μg/ml) or not (CT) of LPS at 37°. After washing, DCs were treated with or without 0.01 μm LTC4 at 37°. Thirty minutes later; cells were washed and co-cultured with allogeneic lymphocytes obtained from BALB/c mice (5 × 10⁴ DCs/well versus 2.5 × 10⁵ splenocytes/well) at 37° for 24 hr in the presence of PMA (10 ng/ml), ionomycin (1 μg/ml) and 5 μg/ml of brefeldin A to inhibit the cytokine release of supernatants. The percentages of positive CD4 T cells for interleukin-17 (IL-17) and interferon-γ (IFN-γ) (a) are shown and represent the arithmetic mean ± SEM of three experiments. In (b) the representative dot plots to IL-17 and IFN-γ CD4+ lymphocytes is shown. (c) Supernatants were recovered after 36 hr of mixed lymphocyte reaction, IL-17 and IFN-γ concentrations were quantified by ELISA. (d) The percentages of positive CD4 T cells for IL-17 and IFN-γ were analysed in the mixed lymphocyte reaction in the presence of the neutralizing antibody anti IL-23p19 (1 μg/ml) during the 24 hr of co-culture. The bars represent the mean values ± SEM of four independent experiments. Asterisk represents statistical significance (*P< 0.05) versus CT and # respresents significance (#P ≤ 0.05) versus LPS.

Similar articles

Cited by

References

    1. Lutz MB, Kurts C. Induction of peripheral CD4+ T-cell tolerance and CD8+ T-cell cross-tolerance by dendritic cells. Eur J Immunol. 2009;32:2325–30. - PubMed
    1. Joffre O, Nolte MA, Spörri R, Reis e Sousa C. Inflammatory signals in dendritic cell activation and the induction of adaptive immunity. Immunol Rev. 2009;227:234–47. - PubMed
    1. Steinman RM, Hemmi H. Dendritic cells: translating innate to adaptive immunity. Curr Top Microbiol Immunol. 2006;311:17–58. - PubMed
    1. Reis e Sousa C. Activation of dendritic cells: translating innate into adaptative immunity. Curr Opin Immunol. 2006;16:21–5. - PubMed
    1. Sabatté J, Maggini J, Nahmod K, et al. Interplay of pathogens, cytokines and other stress signals in the regulation of dendritic cell function. Cytokine Growth Factor Rev. 2007;18:5–17. - PubMed

Publication types