. 2011 Oct 28;286(43):37625-38.
doi: 10.1074/jbc.M111.260612. Epub 2011 Sep 5.

The endosomal Na(+)/H(+) exchanger contributes to multivesicular body formation by regulating the recruitment of ESCRT-0 Vps27p to the endosomal membrane

Affiliations

The endosomal Na(+)/H(+) exchanger contributes to multivesicular body formation by regulating the recruitment of ESCRT-0 Vps27p to the endosomal membrane

Keiji Mitsui et al. J Biol Chem. .

Abstract

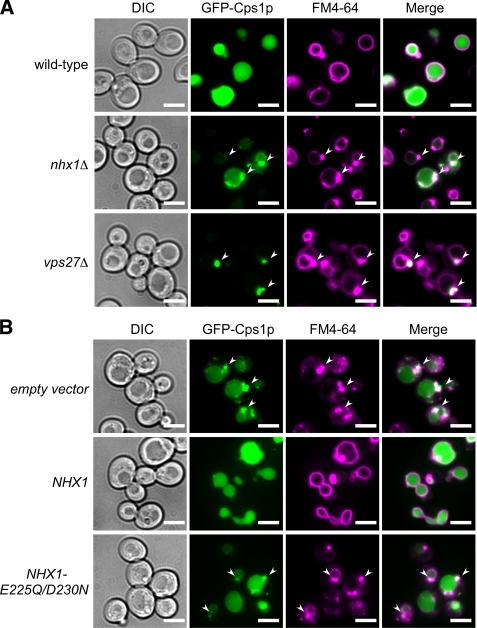
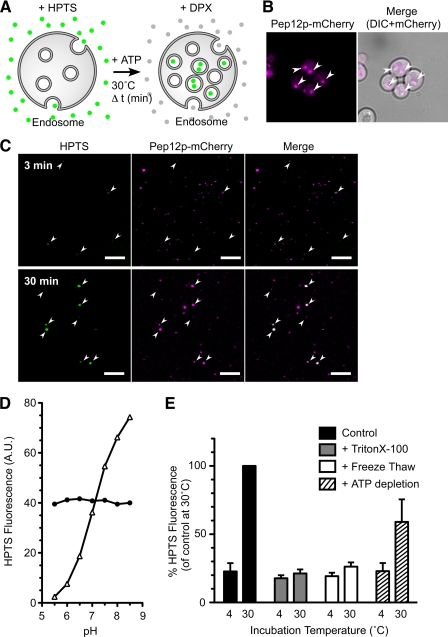
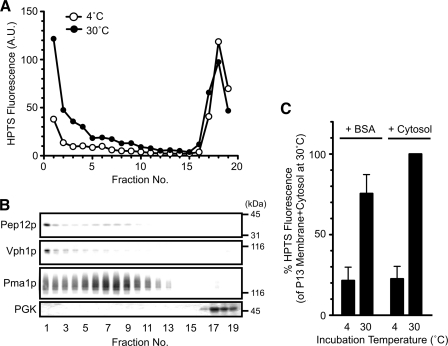
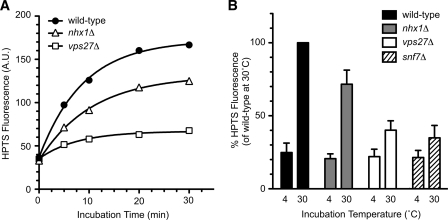
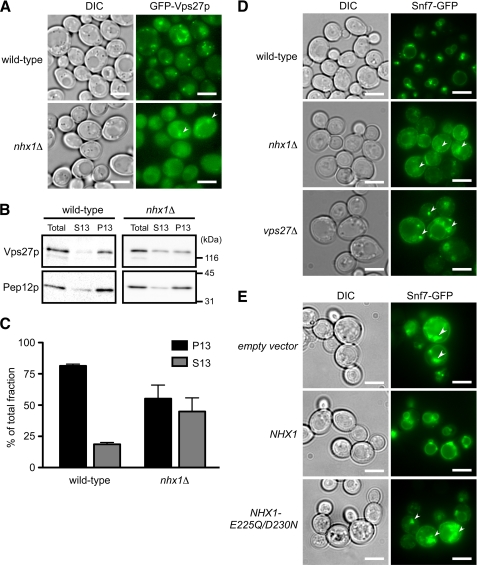
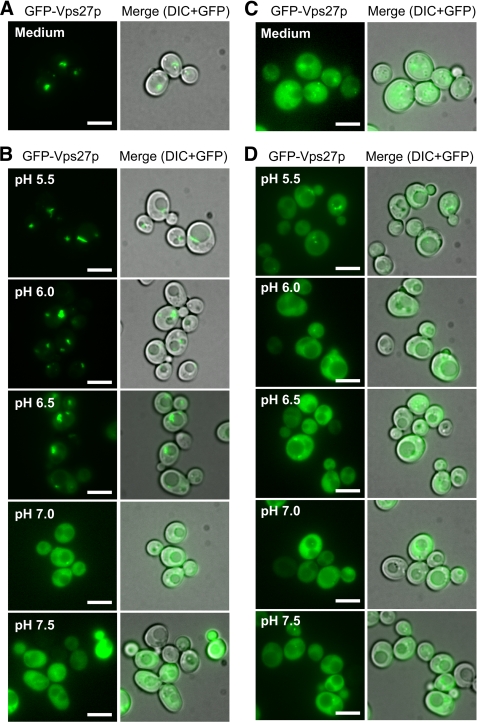
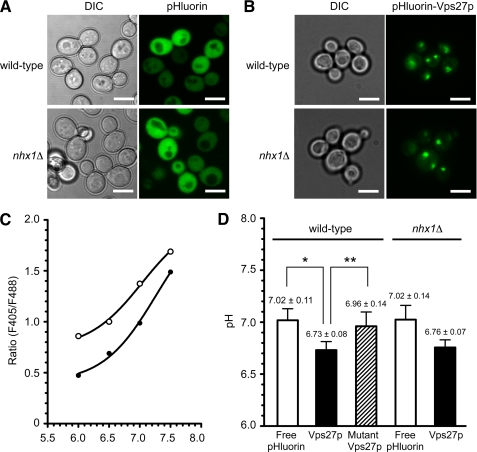
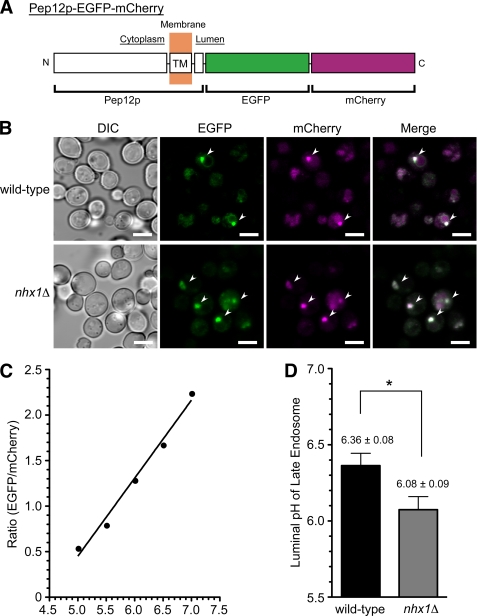
Multivesicular bodies (MVBs) are late endosomal compartments containing luminal vesicles (MVB vesicles) that are formed by inward budding of the endosomal membrane. In budding yeast, MVBs are an important cellular mechanism for the transport of membrane proteins to the vacuolar lumen. This process requires a class E subset of vacuolar protein sorting (VPS) genes. VPS44 (allelic to NHX1) encodes an endosome-localized Na(+)/H(+) exchanger. The function of the VPS44 exchanger in the context of vacuolar protein transport is largely unknown. Using a cell-free MVB formation assay system, we demonstrated that Nhx1p is required for the efficient formation of MVB vesicles in the late endosome. The recruitment of Vps27p, a class E Vps protein, to the endosomal membrane was dependent on Nhx1p activity and was enhanced by an acidic pH at the endosomal surface. Taken together, we propose that Nhx1p contributes to MVB formation by the recruitment of Vps27p to the endosomal membrane, possibly through Nhx1p antiporter activity.


Figures

FIGURE 1.
FIGURE 1.
Nhx1p is required for GFP-Cps1p transport into the vacuolar lumen via the MVB pathway. A, intracellular localization of GFP-Cps1p and FM4-64 is shown. Wild-type (BY4742), nhx1Δ (MKY0804), and vps27Δ (MKY0806) yeast strains transformed with pRS316GAP1p-GFP-CPS1 were grown to logarithmic phase in APG medium adjusted to pH 5.5 and stained with FM4-64 dye. The intracellular localization of GFP-Cps1p (green) and FM4-64 (magenta) was observed under a fluorescence microscope. Arrows indicate class E compartments. Scale bars, 5 μm. B, shown is the effect of Nhx1p activity on GFP-Cps1p transport into the vacuolar lumen. Yeast strain nhx1Δ cells (MKY0614) expressing GFP-Cps1p were transformed with pRS314 (empty vector), pRS314-NHX1-FLAG (NHX1), or pRS314-NHX1-E225Q/D230N-FLAG (NHX1-E225Q/D230N). The cells were grown to logarithmic phase in APG medium (pH 5.5) and stained with FM4-64 dye. The intracellular localization of GFP-Cps1p (green) and FM4-64 (magenta) was observed under a fluorescence microscope. Arrows indicate class E compartments. Scale bars, 5 μm.
FIGURE 2.
FIGURE 2.
Temperature- and ATP-dependent HPTS uptake into membrane vesicles. A, shown is a schematic representation of the cell-free assay for MVB formation. Yeast lysates were incubated with HPTS (green circles) at 30 °C in the presence of ATP. After incubation, HPTS taken up into the endosomes was protected from DPX, whereas HPTS that remained outside the endosomes was quenched by DPX (gray circles). B, shown is intracellular localization of Pep12p-mCherry. Wild-type cells (BY4742) transformed with pRS316GAP1p-PEP12-mCherry were grown to logarithmic phase in APG medium (pH 5.5) at 30 °C and observed with a fluorescence microscope. Arrows indicate the location of signals for Pep12-mCherry. Scale bars, 5 μm. C, yeast cells (BY4742) expressing Pep12p-mCherry were grown to early logarithmic phase in APG medium (pH 5.5) at 30 °C, converted to spheroplasts, and disrupted as described under “Experimental Procedures.” The resulting lysates were incubated with 1 mm HPTS at 30 °C for the indicated time. After treatment with DPX, the lysates were immediately observed under a laser confocal microscope. Arrows indicate the positions of HPTS signals. Scale bars, 5 μm. D, shown is pH dependence of HPTS fluorescence. Fluorescence intensity of HPTS was measured with excitation at 417 nm (closed circle) and 463 nm (open triangle) in a 150 mm NaCl solution adjusted to pH 5.5, 6.0, 6.5, 7.0, 7.5, 8.0, or 8.5 with 20 mm MES (pH 5.5–6.5) and HEPES (pH 7.0–8.5). A.U., absorbance units. E, shown is characterization of HPTS uptake into late endosomes. Lysate prepared from wild-type cells (BY4742) was incubated with 1 mm HPTS dye for 30 min at 4 °C or 30 °C in the presence of an ATP-regenerating solution (black bars, control) or without ATP (hatched bars, + ATP depletion). The amount of HPTS trapped in late endosomes was quantified by a fluorometer after the addition of DPX. Lysates with detergent (gray bars, + Triton X-100) or freeze-thawed (white bars, + Freeze Thaw) were used in this assay. Data express the HPTS level relative to control at 30 °C and represent the means ± S.D. of at least three independent experiments.
FIGURE 3.
FIGURE 3.
HPTS is incorporated into endosomal membranes during incubation. A and B, wild-type cells (BY4742) were grown to logarithmic phase in YPAD medium at 30 °C, converted to spheroplasts, and disrupted as described under “Experimental Procedures.” The resulting lysate was subjected to 12–30% OptiPrep density gradient centrifugation after incubation with HPTS at 4 or 30 °C for 30 min in the presence of ATP-regenerating solution. Next, 19 fractions of equal volume were collected from the top of the tube. The HPTS level in each fraction was quantified with a fluorometer (A) and analyzed by SDS-PAGE and immunoblotting using anti-Pep12p (late endosome), anti-Vph1p (vacuole), anti-Pma1p (plasma membrane), and anti-3-phosphoglycerate kinase (cytoplasm) antibodies (B). A.U., absorbance units. C, wild-type cells (BY4742) were grown to early logarithmic phase in YPAD medium, converted to spheroplasts, and disrupted. The resulting lysate was further centrifuged at 13,000 × g for 15 min to obtain endosome-enriched membranes (P13 membranes). The P13 membranes were incubated with BSA or a cytosolic fraction in the presence of the ATP-regenerating solution at 4 or 30 °C for 30 min. HPTS uptake was quantified with a fluorometer. Data express the HPTS level relative to that of the P13 membrane + cytosol at 30 °C and represent the means ± S.D. of at least three independent experiments.
FIGURE 4.
FIGURE 4.
Nhx1p mediates the formation of MVB vesicles in endosomes. Wild-type (BY4742), nhx1Δ (MKY0804), vps27Δ (MKY0806), and snf7Δ (MKY1001) cells were grown to early logarithmic phase in YPAD medium at 30 °C, converted to spheroplasts, and disrupted as described under “Experimental Procedures.” The resulting lysates were incubated with 1 mm HPTS in the presence of ATP-regenerating solution. A, after incubation at 30 °C for the indicated time periods, HPTS levels were quantified with a fluorometer. B, HPTS levels from lysates of wild-type (black bars), nhx1Δ (gray bars), vps27Δ (white bars), and snf7Δ (hatched bars) cells were quantified after incubation for 30 min at 4 °C or 30 °C. Data express the HPTS level relative to wild-type cells at 30 °C and represent the means ± S.D. of at least four independent experiments.
FIGURE 5.
FIGURE 5.
Nhx1p activity is required for the endosomal recruitment of ESCRT proteins. A, intracellular localization of GFP-Vps27p in wild-type and nhx1Δ cells is shown. Wild-type (BY4742) or nhx1Δ (MKY0804) cells expressing GFP-Vps27p (pRS316-GFP-VPS27) with its own promoter and a low-copy plasmid were grown to logarithmic phase in APG medium (pH 5.5) at 30 °C and then observed with a fluorescence microscope. Arrows indicate class E compartments. Scale bars, 5 μm. B, subcellular fractionation and immunoblotting analysis of wild-type (VPS27-TAP) or nhx1Δ (YYY01) cells expressing Vps27p-TAP is shown. Lysate (total) was separated into a membrane-associated pellet (P13) and soluble cytosolic (S13) fraction. Each fraction was resolved by SDS-PAGE and analyzed by immunoblotting using anti-TAP and anti-Pep12p antibodies. Pep12p was used as the endosomal membrane-associated control. C, the intensity of the immunoreactive bands was quantified using Image J software, and the amounts of Vps27p-TAP in the P13 (black bars) and S13 (gray bars) fractions are shown as the relative intensity (%) compared with Vps27p-TAP in the total fraction. Data shown are the average of three independent experiments ± S.D. D, shown is intracellular localization of the ESCRT-III protein Snf7p-GFP. Wild-type (BY4742), nhx1Δ (MKY0804), and vps27Δ (MKY0806) cells transformed with pRS316-SNF7-GFP were grown to the logarithmic phase in APG medium (pH 5.5) and observed with a fluorescence microscope. Arrows indicate the class E compartments. Scale bars, 5 μm. E, contribution of Nhx1p activity to Snf7-GFP localization is shown. nhx1Δ (MKY0614) cells expressing Snf7p-GFP were transformed with pRS314 (empty vector), pRS314-NHX1-FLAG (NHX1), or pRS314-NHX1-E225Q/D230N-FLAG (NHX1-E225Q/D230N). The cells were grown to logarithmic phase in APG medium (pH 5.5) and observed with a fluorescence microscope. Arrows indicate the class E compartments. Scale bars, 5 μm.
FIGURE 6.
FIGURE 6.
Interaction of GFP-Vps27p with the endosomal membrane depends on intracellular pH. A, intracellular localization of GFP-Vps27p in growing cells is shown. Yeast cells (BY4742) transformed with pRS316GAP1p-GFP-VPS27 were grown to logarithmic phase in APG medium (pH 5.5) at 30 °C and observed with a fluorescence microscope. Scale bars, 5 μm. B, pH dependence of GFP-Vps27 localization is shown. Yeast cells (BY4742) expressing GFP-Vps27p were collected by centrifugation and resuspended in ionophore buffers adjusted to the indicated pH. Distribution of GFP-Vps27p was immediately observed under a fluorescence microscope. Scale bars, 5 μm. C, intracellular localization of mutant GFP-Vps27p-H190A/H191A in growing cells. Yeast cells (BY4742) transformed with pRS316GAP1p-GFP-VPS27-H190A/H191A were grown to logarithmic phase in APG medium (pH 5.5) at 30 °C and observed with a fluorescence microscope. Scale bars, 5 μm. D, shown is pH dependence of mutant GFP-Vps27-H190A/H191A localization. Yeast cells (BY4742) expressing GFP-Vps27p-H190A/H191A were collected by centrifugation and resuspended in ionophore buffer adjusted to the indicated pH. Distribution of the mutant GFP-Vps27p was immediately observed under a fluorescence microscope. Scale bars, 5 μm.
FIGURE 7.
FIGURE 7.
In vitro MVB formation is pH-dependent. A and B, yeast cells (BY4742) were grown to early logarithmic phase in YPAD medium, converted to spheroplasts, and disrupted as described under “Experimental Procedures.” The resulting lysate was incubated with 1 mm HPTS for 30 min at 4 °C (open circles) or 30 °C (closed circles) at the indicated pH, and trapped HPTS levels were quantified. The assays were performed in the absence of ionophores (A) or in the presence of ionophores (B). Data are expressed as the HPTS levels relative to pH 5.5 at 30 °C and represent the means ± S.D. of at least three independent experiments.
FIGURE 8.
FIGURE 8.
The cytoplasmic surface pH of endosomes is acidified compared with the bulk cytoplasmic space. A and B, shown is intracellular localization of free pHluorin (A) and pHluorin-Vps27p (B) in wild-type and nhx1Δ cells. Wild-type (BY4742) and nhx1Δ (MKY0804) cells transformed with pRS316GAP1p-pHluorin or pRS316GAP1p-pHluorin-VPS27 were grown to the logarithmic phase in APG medium (pH 5.5) at 30 °C and observed with a fluorescence microscope. Scale bars, 5 μm. C, representative pH standard curves for free pHluroin and pHluorin-Vps27p are shown. Cells expressing free pHluorin (closed circles) or pHluorin-Vps27p (open circles) were grown to logarithmic phase in APG medium (pH 5.5) at 30 °C and then incubated in pH calibration buffer preadjusted to the indicated pH. The cells were sequentially excited with 405- and 488-nm lasers, and fluorescence images for pHluorin were obtained with a laser confocal microscope and the ratios (fluorescence intensity 405/488 nm) plotted. D, a comparison of bulk cytoplasmic pH (for free pHluorin) and endosomal surface pH (for pHluorin-Vps27p) is shown. Wild-type (BY4742) or nhx1Δ (MKY0804) cells transformed with pRS316GAP1p-pHluorin, pRS316GAP1p-pHluorin-VPS27, or pRS316GAP1p-pHlorin-VPS27-H190A/H191A were grown to logarithmic phase in APG medium (pH 5.5) at 30 °C and fixed on glass bottom dishes coated with concanavalin A. The cells were sequentially excited with 405- and 488-nm lasers, and fluorescence images for pHluorin were obtained with a laser confocal microscope. pH values were calculated from the ratios (fluorescence intensity 405/488 nm). White bar, free pHluorin; black bar, pHluroin-Vps27p; hatched bar, pHluroin-Vps27p-H190A/H191A. Data are the means ± S.D. of at least three independent experiments. *, p < 0.005; **, p < 0.05.
FIGURE 9.
FIGURE 9.
Loss of Nhx1p causes acidification of the endosomal lumen. A, shown is a schematic illustration of the chimeric protein used as a late endosome-targeted pH probe. EGFP (pH-sensitive) and mCherry (pH-insensitive) were fused to the C terminus of the late endosome-localized t-SNARE protein, Pep12p. TM, transmembrane. B, wild-type (BY4742) and nhx1Δ (MKY0804) cells transformed with pRS316GAP1p-PEP12-EGFP-mCherry were grown to logarithmic phase in APG medium (pH 5.5) at 30 °C and then fixed on glass-bottom dishes coated with concanavalin A. Fluorescence images of EGFP (green) and mCherry (magenta) were obtained with a laser scanning confocal microscope. Scale bars, 5 μm. C, representative pH standard curve for the endosomal pH probe. Yeast cells expressing Pep12p-EGFP-mCherry were grown to logarithmic phase in APG medium (pH 5.5) at 30 °C and then incubated in pH calibration buffer preadjusted to the indicated pH. Fluorescence intensities of EGFP and mCherry were measured with a laser confocal microscope, and the ratios (EGFP/mCherry) are plotted. D, wild-type (BY4742) or nhx1Δ (MKY0804) cells transformed with pRS316GAP1p-PEP12-EGFP-mCherry were grown to logarithmic phase in APG medium (pH 5.5) at 30 °C and fixed on glass-bottom dishes coated with concanavalin A. The fluorescence intensities of EGFP and mCherry were obtained with a laser confocal microscope, and the luminal pH of the endosome was calculated from the ratio of fluorescence intensities (EGFP/mCherry). Data are presented as the means ± S.D. of at least four independent experiments. *, p < 0.005.

Similar articles

Cited by

References

    1. Lee J. A., Beigneux A., Ahmad S. T., Young S. G., Gao F. B. (2007) Curr. Biol. 17, 1561–1567 - PubMed
    1. Katzmann D. J., Odorizzi G., Emr S. D. (2002) Nat. Rev. Mol. Cell Biol. 3, 893–905 - PubMed
    1. Raiborg C., Stenmark H. (2009) Nature 458, 445–452 - PubMed
    1. Filimonenko M., Stuffers S., Raiborg C., Yamamoto A., Malerød L., Fisher E. M., Isaacs A., Brech A., Stenmark H., Simonsen A. (2007) J. Cell Biol. 179, 485–500 - PMC - PubMed
    1. Carlton J. G., Martin-Serrano J. (2007) Science 316, 1908–1912 - PubMed

Publication types

MeSH terms

Substances

LinkOut - more resources