. 2011 Sep 6;30(21):4450-64.
doi: 10.1038/emboj.2011.317.

Epigenetic silencing of the oncogenic miR-17-92 cluster during PU.1-directed macrophage differentiation

Affiliations

Epigenetic silencing of the oncogenic miR-17-92 cluster during PU.1-directed macrophage differentiation

Vit Pospisil et al. EMBO J. .

Abstract

The oncogenic cluster miR-17-92 encodes seven related microRNAs that regulate cell proliferation, apoptosis and development. Expression of miR-17-92 cluster is decreased upon cell differentiation. Here, we report a novel mechanism of the regulation of miR-17-92 cluster. Using transgenic PU.1(-/-) myeloid progenitors we show that upon macrophage differentiation, the transcription factor PU.1 induces the secondary determinant Egr2 which, in turn, directly represses miR-17-92 expression by recruiting histone demethylase Jarid1b leading to histone H3 lysine K4 demethylation within the CpG island at the miR-17-92 promoter. Conversely, Egr2 itself is targeted by miR-17-92, indicating existence of mutual regulatory relationship between miR-17-92 and Egr2. Furthermore, restoring EGR2 levels in primary acute myeloid leukaemia blasts expressing elevated levels of miR-17-92 and low levels of PU.1 and EGR2 leads to downregulation of miR-17-92 and restored expression of its targets p21CIP1 and BIM. We propose that upon macrophage differentiation PU.1 represses the miR-17-92 cluster promoter by an Egr-2/Jarid1b-mediated H3K4 demethylation mechanism whose deregulation may contribute to leukaemic states.


Conflict of interest statement

The authors declare that they have no conflict of interest.

Figures

Figure 1
Figure 1
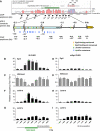
The miR-17-92 and 106b-25 clusters are downregulated upon PU.1-mediated macrophage differentiation. (A) Schematic representation of the murine miR-17-92 cluster and its paralogues. Coloured boxes represent pre-miRNAs and black boxes mature miRNAs. Four families of miRs with the identical seed sequence are indicated by colour and arrows. (B) Expression of mature miRs of the miR-17-92 cluster evaluated by qPCR. PUER cells were stimulated by increasing concentration of Tamoxifen (X axis) for 96 h. (C, D) PUER cells were stimulated by 2.5 μM Tamoxifen for 96 h and expression of pri-miRNA transcripts (C) and macrophage-specific transcripts (D) was evaluated. (E) PUER cells were stimulated by 2.5 μM Tamoxifen for 24, 48 and 96 h and expression of mature miRNAs was analysed. Y axis (BE) indicates fold change of normalized expression relative to untreated cells. Baseline represents expression value of untreated cells. Mean±s.d. (n=3). (FH) Ectopic expression of miR-17-92 cluster inhibits PU.1-induced macrophage differentiation. PUER cells were co-transfected with expression vector encoding the miR-17-92 cluster (pCDNA3(17-92)) or empty vector (control) and subsequently stimulated by 2.5 μM Tamoxifen for 96 h. (F) Morphology of transfected PUER cells, evaluated by Wright-Giemsa staining (upper panels, magnification × 400, scale bar 10 μM) or phase contrast (lower panels, magnification × 100). (G) FACS analysis of F4/80 expression (X axis)/cell counts (Y axis). (H) mRNA expression of Csfr1 and F4/80 evaluated by qPCR. Mean±s.d. (n=3).
Figure 2
Figure 2
Egr2 inhibits the miR-17-92 cluster. (A) Expression of Egr2 in PUER cells stimulated by 2.5 μM Tamoxifen for indicated time (hours), determined by gene expression array. Y axis represents normalized values of Egr2 mRNA relative to untreated cells. (B, C) Expression of mRNA, pri-miRNAs and mature miRNAs evaluated by qPCR. PUER cells were nucleofected with pEGR2 or control empty vector and pEGFP followed by sorting at 96 h for GFP-intermediate expression and GFP-highly positive cells. Mean±s.d. (n=3). (D) PUER WT and shEgr2 cells, stably expressing small hairpin inhibitory RNA against Egr2, were treated with 2.5 μM Tamoxifen for 96 h and expression of mRNA, miRNAs, pri-miRNAs was determined. (BD) Expression values were normalized to Gapdh (mRNA) or Sno202 (miRs) and equalized to untreated cells. Mean±s.d.(n=3). (E, F) NIH 3T3 cells were transfected with pGL3(−3.2; 0) reporter vector and increasing amounts of pCB6-Egr2 (E) or pCB6-Egr2 and pXM-PU.1 (F), as indicated on X axis. The Y axis represents firefly luciferase activity, normalized to Renilla luciferase and relative to the empty vector. Mean±s.d. (n=3). The panels are accompanied by western blot analysis of Egr2 and Actin as a loading control (placed on the bottom).
Figure 3
Figure 3
Egr2 binds the miR-17-92 promoter and recruits Jarid1b to demethylate H3K4me3. (A) Vista plot (http://genome.lbl.gov/vista/) and scheme of putative promoter region of miR-17-92 cluster. Vertical arrows indicate positions of primers utilized for amplification of DNA fragments of miR-17-92 upstream region used in reporter assays, horizontal arrows indicate ChIP qPCR amplicons. Colour boxes represent binding and consensus sites of Egr2, Jarid1a and Jarid1b. (BI) ChIP analysis of miR-17-92 promoter region. PUER cells (BE) or shEgr2 PUER cells (DI) were differentiated by 2.5 μM Tamoxifen for 96 h and chromatin was precipitated with indicated antibodies. Y axis represents occupancy of Tamoxifen treated relative to Tamoxifen untreated cells. H3K4me3 values were further equalized to Histone H3. X axis represents the position of ChIP amplicons relative to start of miR-17-5p. Mean±s.d. (n=3).
Figure 4
Figure 4
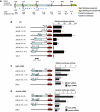
Egr2 and Jarid1b regulate miR-17-92 promoter. (A) Schematic representation of the miR-17-92 upstream region. Arrows and boxes are same as Figure 3A. (B) PUER cells were transfected with pGL3 constructs (breakpoints are shown in parentheses in kb relative to the first nucleotide of 17-5p pre-miR), and differentiated by 2.5 μM Tamoxifen for 96 h. (C, D) PUER cells were co-transfected with indicated pGL3 constructs and siRNA inhibiting Egr2 (C) or Jarid1b (D) and treated with 2.5 μM Tamoxifen for 96 h. The Y axis represents firefly luciferase activity of indicated reporter vectors, normalized to Rennila luciferase and relative to the activity of empty vector (A) or to the activity of Ctrl siRNA-treated cells (B, C). CpG island is visualized by blue colour the repressive region (−2.7 to −2.0kb) by grey colour. Mean±s.d. (n=3).
Figure 5
Figure 5
Egr2 is a target of the miR-17-92 cluster. (A) Schematic representation of pGL3(EGR2 3′UTR) construct and pairing of miRs of miR-17-92, 106b-25 and 106a-363 clusters to the WT (top) and mutated Egr2 3′UTR (bottom). Boxes represent predicted binding sites of indicated miRs. (B) Unstimulated PUER progenitors, expressing high level of miR-17-92 were transfected with pGL3-Egr2 3′UTR wild-type (wt) or mutated (mut) vector and co-transfected with miR-17-5p or with miR-17-5p and miR20a microRNA inhibitors or scrambled control (indicated bellow). The ratio of normalized luciferase activity (at 48 h) of wt versus mut pGL3-Egr2 3′UTR vector is shown. Mean±s.d. (n=3). (C) 3T3 cells were transfected with the pCDNA(17-92) or empty vector and cultured 12 h in absence of serum. The levels of Egr2 protein at 1.5 h following the serum stimulation were evaluated by western blotting. (D) Model of mutual regulation of Egr2 and miR-17-92 upon macrophage differentiation.
Figure 6
Figure 6
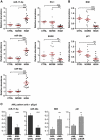
The miR-17-92 cluster is upregulated in a subset of AML patients. Expression of miR-17-5p, 20a, 92, PU.1, EGR2 (A), BIM and p21 (B) was analysed in 27 AML patients PBMCs by qPCR. Depending on the expression levels of miR-17-5p, 20a and 92a, the patients were subdivided into two groups with either elevated (HIGH) or normal (NORM) levels of miR-17-92 (X axis). Values are normalized to RNU44 or GAPDH and are relative to average expression value of healthy controls (CTRL) (n=6). Mean±s.e.m. values are shown. (C) AML patient cells were nucleofected by 5 μg of pEGR2 or empty vector (control) and 1 μg pEGFP, sorted by FACS and analysed after 96 h by qPCR. Values are normalized to RNU44 or GAPDH. Mean±s.e.m. (n=2). *P<0.05, **P<0.01, *** P<0.001.
Figure 7
Figure 7
Model of regulation of miR-17-92 cluster. (A) Upon macrophage differentiation, PU.1 stimulates expression of transcription factor Egr2, which in turn recruits demethylase Jarid1b to demethylate H3K4 of miR-17-92 cluster promoter, leading to downregulation of miR-17-92 expression, thus releasing a transcriptional block of its targets that include important differentiation factors and cell-cycle inhibitors resulting in macrophage differentiation. (B) In proliferating progenitor cells or in AML, low levels of PU.1 are not capable of stimulating Egr2. Low levels of Egr2 are not able to repress expression of miR-17-92 cluster. Elevated levels of miR-17-92 stimulate proliferation and survival of the cells and silence factors required for myeloid differentiation or cell-cycle arrest and apoptosis.

Similar articles

Cited by

References

    1. Back J, Dierich A, Bronn C, Kastner P, Chan S (2004) PU.1 determines the self-renewal capacity of erythroid progenitor cells. Blood 103: 3615–3623 - PubMed
    1. Barski A, Cuddapah S, Cui K, Roh TY, Schones DE, Wang Z, Wei G, Chepelev I, Zhao K (2007) High-resolution profiling of histone methylations in the human genome. Cell 129: 823–837 - PubMed
    1. Bartel DP (2004) MicroRNAs: genomics, biogenesis, mechanism, and function. Cell 116: 281–297 - PubMed
    1. Bernstein BE, Humphrey E.L, Erlich R.L, Schneider R, Bouman P, Liu J.S, Kouzarides T, Schreiber S.L. (2002) Methylation of histone H3 Lys 4 in coding regions of active genes. Proc Natl Acad Sci USA 99: 8695–8700 - PMC - PubMed
    1. Bernstein BE, Kamal M, Lindblad-Toh K, Bekiranov S, Bailey DK, Huebert DJ, McMahon S, Karlsson EK, Kulbokas EJ 3rd, Gingeras TR, Schreiber SL, Lander ES (2005) Genomic maps and comparative analysis of histone modifications in human and mouse. Cell 120: 169–181 - PubMed

Publication types

MeSH terms