

Trends in the Educational Gradient of U.S. Adult Mortality from 1986 to 2006 by Race, Gender, and Age Group
- PMID: 21897495
- PMCID: PMC3166515
- DOI: 10.1177/0164027510392388
Trends in the Educational Gradient of U.S. Adult Mortality from 1986 to 2006 by Race, Gender, and Age Group
Abstract
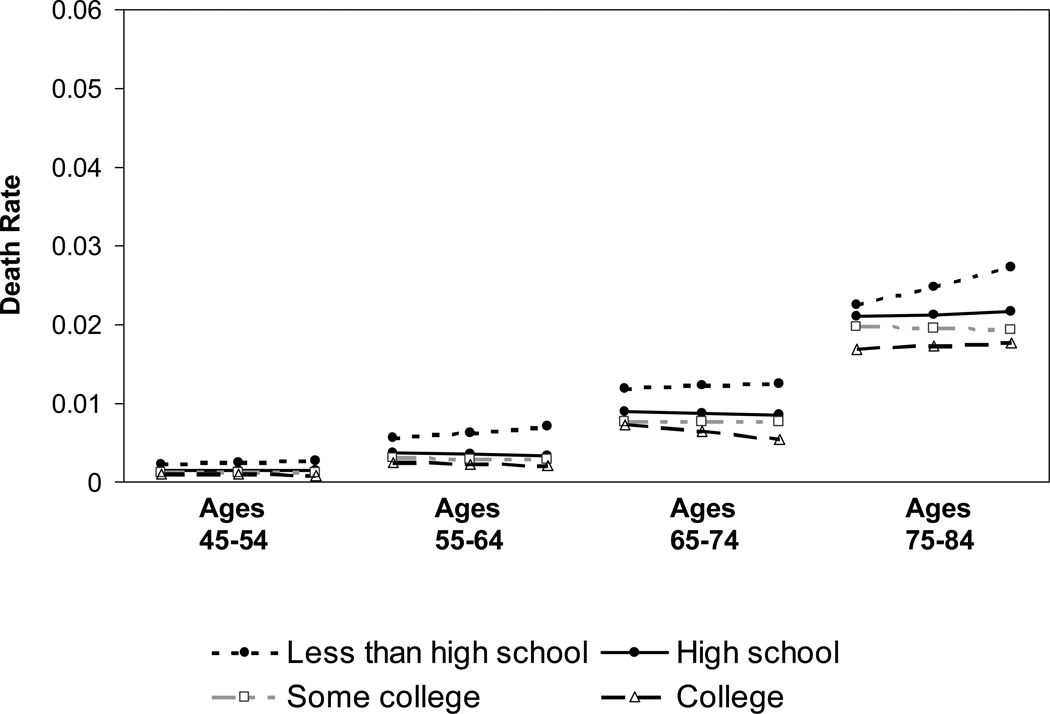
The educational gradient of U.S. adult mortality became steeper between 1960 and the mid 1980s, but whether it continued to steepen is less clear given a dearth of attention to these trends since that time. This study provides new evidence on trends in the education-mortality gradient from 1986 to 2006 by race, gender, and age among non-Hispanic whites and blacks using data from the 2010 release of the National Health Interview Survey Linked Mortality File. Results show that, for white and black men, the gradient steepened among older ages because declines in mortality risk across education levels were greater among the higher educated. The gradient steepened among white women, and to a much lesser and only marginally significant extent among black women, largely because mortality risk decreased among the college-educated but increased among women with less than a high school degree. Greater returns to higher education and compositional changes within educational strata likely contributed to the trends.
Figures


References
-
- Alexander Karl L, Entwisle Doris R, Kabbani Nader S. The Dropout Process in Life Course Perspective: Early Risk Factors at Home and School. Teachers College Record. 2001;103:760–822.
-
- Arias Elizabeth. United States Life Tables, 2006. National Vital Statistics Reports. Vol 58 No 21. Hyattsville, MD: National Center for Health Statistics; 2010. - PubMed
-
- Bishop Christine E. Where Are the Missing Elders? The Decline in Nursing Home Use, 1985 and 1995. Health Affairs. 1999;18:146–155. - PubMed
-
- Carnes Bruce A, Olshansky S Jay. A Realistic View of Aging, Mortality, and Future Longevity. Population and Development Review. 2007;33:367–381.
-
- Centers for Disease Control. Cigarette Smoking among Adults - United States, 2007. Morbidity and Mortality Weekly Report. 2008;57:1221–1226. - PubMed
Grants and funding
LinkOut - more resources
Full Text Sources
