

Enhanced S-cone function with preserved rod function: a new clinical phenotype
- PMID: 21897746
- PMCID: PMC3164686
Enhanced S-cone function with preserved rod function: a new clinical phenotype
Abstract
Purpose: To describe the clinical findings and genetic analysis in two brothers having a novel retinal disease characterized by an enhanced S-cone phenotype with normal rod function.
Methods: Both patients underwent complete ophthalmologic examinations, including fundus photography, electroretinography (ERG), fluorescein angiography and optical coherence tomography (OCT). Mutation analysis of the following candidate genes was performed: nuclear receptor subfamily 2 group E member 3 (NR2E3), neural retina leucine zipper (NRL), nuclear receptor subfamily 1 group D member 1 (NR1D1), and thyroid hormone receptor beta (THRB).
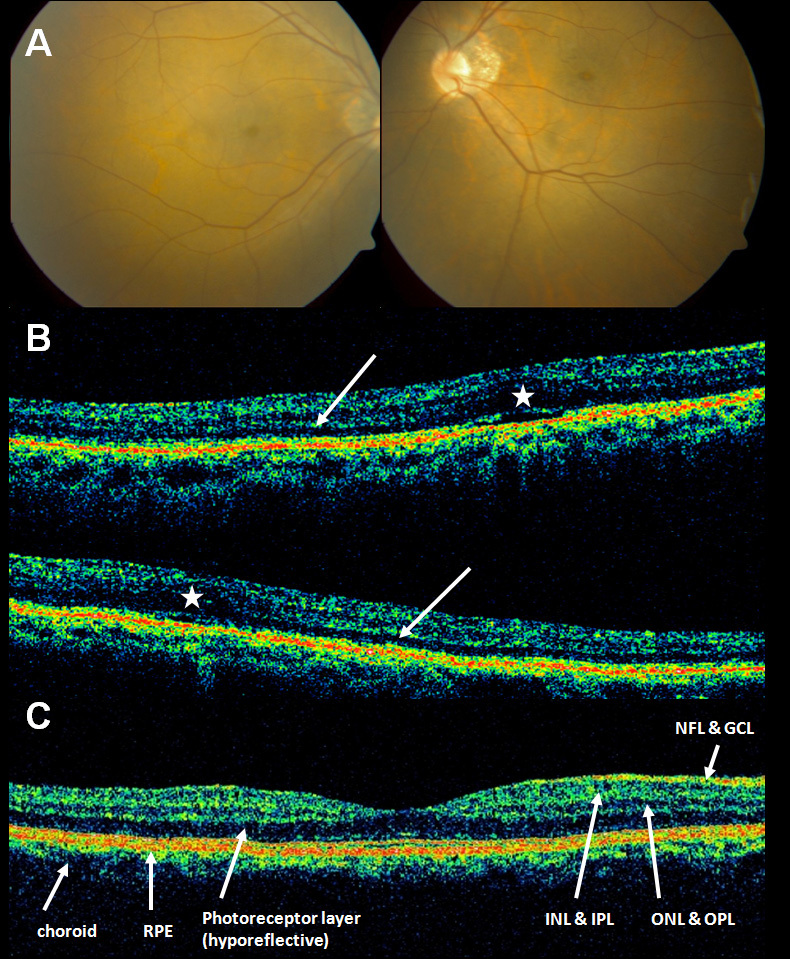
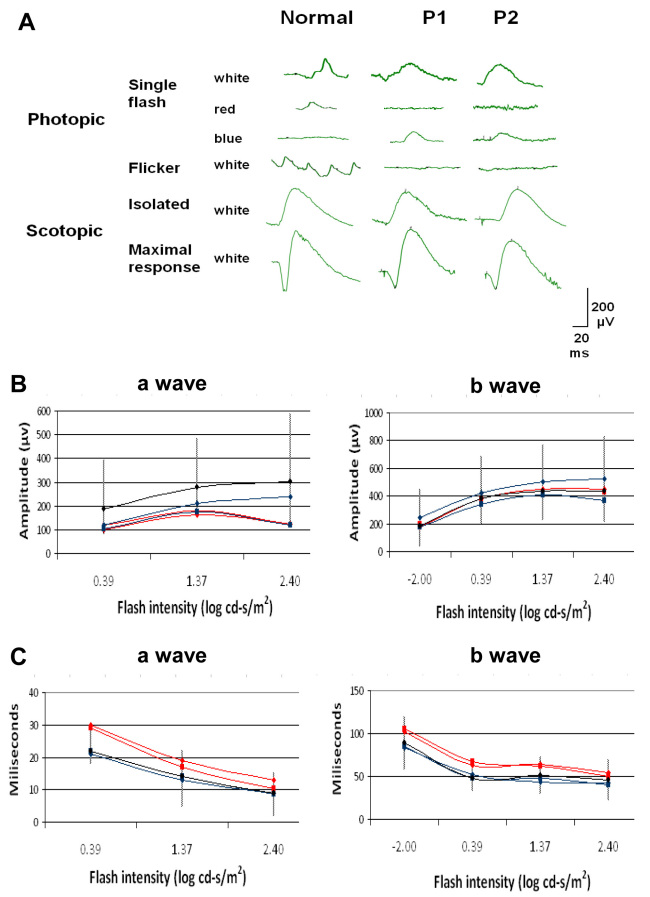
Results: Spectral photopic ERG responses demonstrated enhanced S-cone function in both patients. Their scotopic b-wave ERG amplitude responses, however, were within normal limits. Their scotopic a-wave amplitude responses were within the lower limit of normal. The a- and b-wave latencies were normal for one sibling and on the upper limit of normal for the other. Peripheral retinal findings were normal. OCT showed flattening of the macular curvature and thinning of the photoreceptor layer. Mutation analysis of NR2E3, NRL, NR1D1, and THRB genes was negative.
Conclusions: We describe what appears to be a previously unidentified familial retinal phenotype with enhanced S-cone function and well preserved rod system function in contrast to the severely reduced rod function seen in the enhanced S-cone syndrome (ESCS). Genetic analysis of candidate genes did not reveal the cause of disease. We postulate that the disease might be caused by mutation of another, as yet unidentified gene, which encodes a protein that functions as a negative inhibitor of rod and S-cone development.
Figures
References
-
- Gouras P. The role of S-cones in human vision. Doc Ophthalmol. 2003;106:5–11. - PubMed
-
- O'Brien KM, Schulte D, Hendrickson AE. Expression of photoreceptor-associated molecules during human fetal eye development. Mol Vis. 2003;9:401–9. - PubMed
-
- Jacobson SG, Marmor MF, Kemp CM, Knighton RW. SWS (blue) cone hypersensitivity in a newly identified retinal degeneration. Invest Ophthalmol Vis Sci. 1990;31:827–38. - PubMed
-
- Marmor MF, Jacobson SG, Foerster MH, Kellner U, Weleber RG. Diagnostic clinical findings of a new syndrome with night blindness, maculopathy, and enhanced S cone sensitivity. Am J Ophthalmol. 1990;110:124–34. - PubMed
-
- Fishman GA, Peachey NS. Rod-cone dystrophy associated with a rod system electroretinogram obtained under photopic conditions. Ophthalmology. 1989;96:913–8. - PubMed
Publication types
MeSH terms
Substances
LinkOut - more resources
Full Text Sources
Other Literature Sources
Medical