Factors that may influence the classification of sleep-wake by wrist actigraphy: the MrOS Sleep Study
- PMID: 21897772
- PMCID: PMC3161768
- DOI: 10.5664/JCSM.1190
Factors that may influence the classification of sleep-wake by wrist actigraphy: the MrOS Sleep Study
Abstract
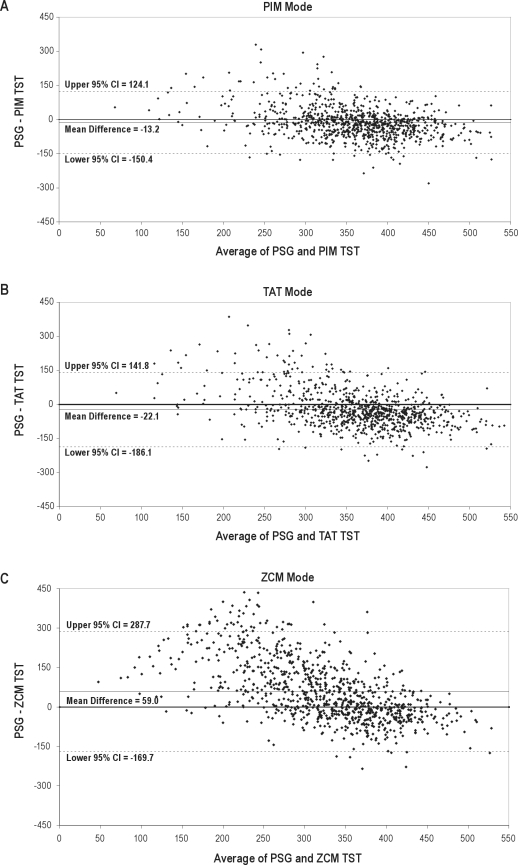
Study objectives: Total sleep time (TST), sleep efficiency (SE), sleep latency (SOL) and wake after sleep onset (WASO) assessed by actigraphy gathered in 3 different modes were compared to polysomnography (PSG) measurements to determine which mode corresponded highest to PSG. Associations of measurement error for TST (PSG-actigraphy) with demographics, medical history, exam data, and sleep characteristics were examined.
Methods: Participants underwent in-home 12-channel PSG. Actigraphy data were collected in 3 modes: proportional integration mode (PIM), time above threshold (TAT) and zero crossings mode (ZCM). The analysis cohort was a subgroup of 889 men (mean age 76.4 years) from the MrOS Sleep Study with concurrently measured PSG and actigraphy. Intraclass correlation coefficients (ICCs) were used to compare the association between PSG and actigraphy.
Results: The PIM mode of actigraphy corresponded moderately to PSG for all measures (ICCs 0.32 to 0.57), TAT a little lower (ICCs 0.17 to 0.47), and ZCM lower still (ICCs 0.16 to 0.33). The PIM mode corresponded best to PSG (ICCs TST 0.57; SE 0.46; SOL 0.23; WASO 0.54), though the estimations from PSG and PIM mode differed significantly (p < 0.01). The PIM mode overestimated TST by 13.2 min on average, but underestimated TST for those in certain subgroups: those with excessive daytime sleepiness, less sleep fragmentation, or more sleep disordered breathing (p < 0.05).
Conclusions: Sleep parameters from the PIM and TAT modes of actigraphy corresponded reasonably well to PSG in this population, with the PIM mode correlating highest. Systematic measurement error was observed within subgroups with different sleep characteristics.
Keywords: Actigraphy; polysomnography; sleep efficiency; total sleep time; validation.
Figures
References
-
- Ancoli-Israel S, Cole R, Alessi C, Chambers M, Moorcroft W, Pollak CP. The role of actigraphy in the study of sleep and circadian rhythms. Sleep. 2003;26:342–92. - PubMed
-
- Morgenthaler T, Alessi C, Friedman L, et al. Standards of Practice Committee; American Academy of Sleep Medicine. Practice parameters for the use of actigraphy in the assessment of sleep and sleep disorders: an update for 2007. Sleep. 2007;30:519–29. - PubMed
-
- de Souza L, Benedito-Silva AA, Pires ML, Poyares D, Tufik S, Calil HM. Further validation of actigraphy for sleep studies. Sleep. 2003;26:81–5. - PubMed
-
- Hedner J, Pillar G, Pittman SD, Zou D, Grote L, White DP. A novel adaptive wrist actigraphy algorithm for sleep-wake assessment in sleep apnea patients. Sleep. 2004;27:1560–6. - PubMed
Publication types
MeSH terms
Grants and funding
- U01 AR45632/AR/NIAMS NIH HHS/United States
- R01 AG008415/AG/NIA NIH HHS/United States
- R01 HL070848/HL/NHLBI NIH HHS/United States
- R01 HL071194/HL/NHLBI NIH HHS/United States
- R01 HL070847/HL/NHLBI NIH HHS/United States
- U01 AR45647/AR/NIAMS NIH HHS/United States
- R01 HL070842/HL/NHLBI NIH HHS/United States
- U01 AR45614/AR/NIAMS NIH HHS/United States
- U01 AR045654/AR/NIAMS NIH HHS/United States
- U01-AG027810/AG/NIA NIH HHS/United States
- R01 HL070838/HL/NHLBI NIH HHS/United States
- U01 AR45583/AR/NIAMS NIH HHS/United States
- R01 HL070839/HL/NHLBI NIH HHS/United States
- R01 HL070837/HL/NHLBI NIH HHS/United States
- U01 AR045632/AR/NIAMS NIH HHS/United States
- U01 AR045614/AR/NIAMS NIH HHS/United States
- U01 AR45654/AR/NIAMS NIH HHS/United States
- U01 AR045583/AR/NIAMS NIH HHS/United States
- R01 HL070841/HL/NHLBI NIH HHS/United States
- U01 AR045647/AR/NIAMS NIH HHS/United States
- U01 AR45580/AR/NIAMS NIH HHS/United States
- U01 AG027810/AG/NIA NIH HHS/United States
- AG08415/AG/NIA NIH HHS/United States
- UL1 RR024140/RR/NCRR NIH HHS/United States
- U01 AR045580/AR/NIAMS NIH HHS/United States
- U01 AG18197/AG/NIA NIH HHS/United States
- U01 AG018197/AG/NIA NIH HHS/United States
LinkOut - more resources
Full Text Sources
Medical