. 2011 Aug 24:5:69.
doi: 10.3389/fnsys.2011.00069. eCollection 2011.

Top-down spatial categorization signal from prefrontal to posterior parietal cortex in the primate

Affiliations

Top-down spatial categorization signal from prefrontal to posterior parietal cortex in the primate

Hugo Merchant et al. Front Syst Neurosci. .

Abstract

In the present study we characterized the strength and time course of category-selective responses in prefrontal cortex and area 7a of the posterior parietal cortex during a match-to-sample spatial categorization task. A monkey was trained to categorize whether the height of a horizontal sample bar, presented in rectangular frame at one of three vertical locations, was "high" or "low," depending on whether its position was above or below the frame's midline. After the display of this sample bar, and after a delay, choice bars were sequentially flashed in two locations: at the top and at the bottom of the frame ("choice" epoch). If the monkey timed its response to the display of the choice bar that matched the sample bar, he was rewarded. We found that cells in prefrontal cortex discriminated category early after the initial sample bar was shown, and continued to differentiate "up" from "down" trials throughout the delay and choice periods. In contrast, parietal cells did not differentiate category until the choice period. Therefore, our results support the notion of a top-down categorical signal that originates in prefrontal cortex and that is only represented in parietal cortex when it is necessary to express the categorical decision through a movement.

Keywords: ROC analysis; neurophysiology of categorization; posterior parietal cortex; prefrontal cortex; rhesus monkey.


Figures

Figure 1
Figure 1
Task and recording. (A) The monkey fixated a spot for 50 ms (“Fixation,” after which a square task box appeared (“Task box”) in one of three vertical locations (above, below, or centered on the fixation spot). Next, a yellow sample bar appeared at 1 of 10 evenly distributed vertical locations within the task box (“Sample”). After a short delay in which only the fixation spot and task box were visible (“Delay”), two green bars appeared at either vertical end of the task box (“Pre-choice”). The monkey's task was to classify the sample bar as either “up” or “down,” depending on whether it was above or below the (invisible) midline of the task box. It made its choice by responding during one of the choice epochs. After the pre-choice period, one of the two green bars, randomly chosen, began to flash on and off (“first choice,” here the top bar flashes first). If the monkey responded during this epoch, it chose the category indicated by the flashing bar (“up” for the top bar, and “down” for the bottom bar). If the monkey responded during the first choice epoch, the trial ended. If it did not respond during this epoch, the other bar began flashing, giving the monkey the opportunity to choose the other category (“second choice,” here indicating “down,” the correct choice in this trial). If the monkey chose correctly, it was rewarded with a drop of juice. (B) Task box and sample bar positions. Yellow bars within each task box indicate the possible locations of sample bars. Red circles indicate the fixation spot. (C) Recording locations. Gray circles indicate recording locations. STS, superior temporal sulcus; IPS, intraparietal sulcus; AS, arcuate sulcus; PS, principal sulcus.
Figure 2
Figure 2
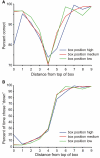
Animal behavior. (A) Performance on the task a function of bar position within the task box. The color of the line indicates the relative position of the task box: blue = high, red = medium, green = low. (B) Psychometric curve of performance. Lines as in (A).
Figure 3
Figure 3
Responses of individual cells and average activity in response to the central sample bars. (A) Raster and spike density functions of a cell grouped by category. Spike density kernel width = 30 ms. (B) Spike density functions of a different cell, averaged across trials of the same bar position as depicted in a color code. Kernel width = 30 ms. (C) Average normalized activity of cells significant for category (across brain areas) in response to presentation of the central four sample bar positions (activity during the sample period). The four central sample bars could all be above or below the fixation point (high and low box positions), or could be split between above and below the fixation point (medium box position). Since categorization was performed with respect to the center of the task box, the up/down categorical and up/down eye-centered positions of these bars were dissociated. Positive numbers on the abscissa indicate sample positions relative to the center of the box, in a cell's preferred category. Error bars indicate SEM.
Figure 4
Figure 4
Independent effects of category, eye-centered stimulus position, and within-box stimulus position. Distribution of cells in prefrontal cortex (PFC) and area 7a (Parietal) showing statistically significant variation in firing rate in response to single or multiple stimulus parameters, during three task epochs: sample, delay, and choice periods. Circles are not to scale.
Figure 5
Figure 5
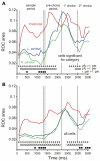
Time course of category signal: ROC analysis. (A) Time course of ROC values over time for cells showing activity in sample, delay, or pre-choice epochs that showed a significant relationship to bar category. The ROC value is defined as the area between the ROC curve and the unity line, and are calculated as the absolute value of (the area under the ROC curve minus 0.5). Line color indicates brain area: red = right prefrontal (N = 42 cells), green = right parietal (N = 46), blue = left parietal (N = 39). Symbols at the bottom of the figure indicate time bins in which ROC values differed significantly between brain areas (two-tailed t-test, p < 0.05; diamonds: prefrontal ≠ right parietal, circles: prefrontal ≠ left parietal, squares: left ≠ right parietal. (B) Time course of ROC values for all cells. Line colors and symbols as in (A). (N = 136, 247, and 215 for right prefrontal, right parietal, and left parietal, respectively.)
Figure 6
Figure 6
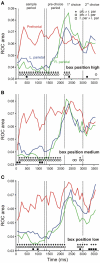
Receiver-operating characteristic analysis for each task box position. (A) Time course of ROC values when the task box was in the high position, the middle position (B) and the low position (C). Line color indicates brain area: red = right prefrontal (N = 42 cells), green = right parietal (N = 46), blue = left parietal (N = 39). Symbols at the bottom of the figure indicate time bins in which ROC values differed significantly between brain areas (two-tailed t-test, p < 0.05; diamonds: prefrontal right parietal, circles: prefrontal left parietal, squares: left right parietal).
Figure 7
Figure 7
Time course of category signal: discriminant analysis. Values indicate the percent of trials correctly classified as either “up” or “down” using neural population activity in 300 ms bins. Chance classification is 50%. The populations include all cells recorded from each brain area. Line color indicates brain area: red = right prefrontal (N = 136 cells), green = right parietal (N = 247), blue = left parietal (N = 215). Symbols at the bottom of the figure indicate time bins in which classification percentage differed significantly between brain areas (two-tailed z test of two proportions, p < 0.05; diamonds: prefrontal ≠ right parietal, circles: prefrontal ≠ left parietal, squares: left ≠ right parietal).
Figure 8
Figure 8
Discriminant analysis time course on error trials. Time course of classification of category on incorrect trials. Values indicate the percent correct classification of the monkey's choices on error trials, using neural population activity in 300 ms bins. Line color indicates brain area: red = right prefrontal, green = right parietal, blue = left parietal. Symbols at the bottom of the figure indicate time bins in which classification percentage differed significantly between brain areas (one-tailed z test of proportion, against 50%, p < 0.05; diamonds: prefrontal > 50%, circles: left parietal > 50%, squares: right parietal > 50%).

References

    1. Ashby F. G., Waldron E. M. (1999). On the nature of implicit categorization. Psychon. Bull. Rev. 6, 363–37810.3758/BF03210826 - DOI - PubMed
    1. Barbas H. (2000). Connections underlying the synthesis of cognition, memory, and emotion in primate prefrontal cortices. Brain Res. Bull. 52, 319–33010.1016/S0361-9230(99)00245-2 - DOI - PubMed
    1. Battaglia-Mayer A., Mascaro M., Brunamonti E., Caminiti R. (2005). The over-representation of contralateral space in parietal cortex: a positive image of directional motor components of neglect? Cereb. Cortex 15, 514–52510.1093/cercor/bhh151 - DOI - PubMed
    1. Battaglia-Mayer A., Mascaro M., Caminiti R. (2007). Temporal evolution and strength of neural activity in parietal cortex during eye and hand movements. Cereb. Cortex 17, 1350–136310.1093/cercor/bhl046 - DOI - PubMed
    1. Caminiti R., Chafee M. V., Battaglia-Mayer A., Averbeck B. B., Crowe D. A., Georgopoulos A. P. (2010). Understanding the parietal lobe syndrome from a neurophysiological and evolutionary perspective. Eur. J. Neurosci. 31, 2320–234010.1111/j.1460-9568.2010.07291.x - DOI - PMC - PubMed

LinkOut - more resources