. 2011 Aug 19:5:14.
doi: 10.3389/fninf.2011.00014. eCollection 2011.

Bivariate and Multivariate NeuroXidence: A Robust and Reliable Method to Detect Modulations of Spike-Spike Synchronization Across Experimental Conditions

Affiliations

Bivariate and Multivariate NeuroXidence: A Robust and Reliable Method to Detect Modulations of Spike-Spike Synchronization Across Experimental Conditions

Wei Wu et al. Front Neuroinform. .

Abstract

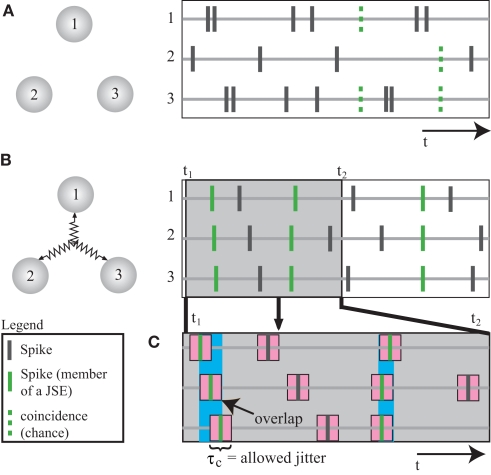
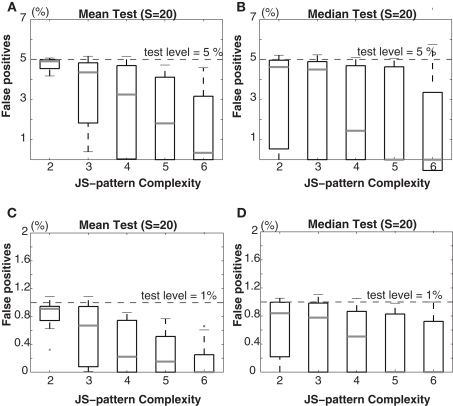
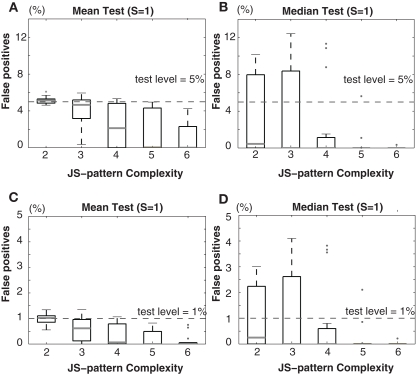
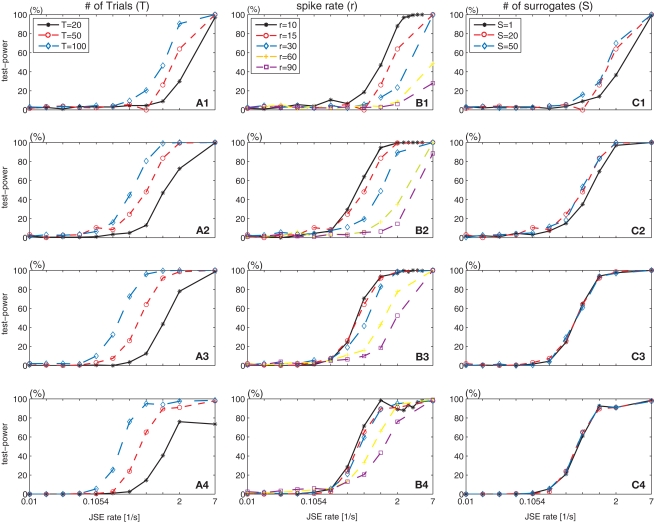
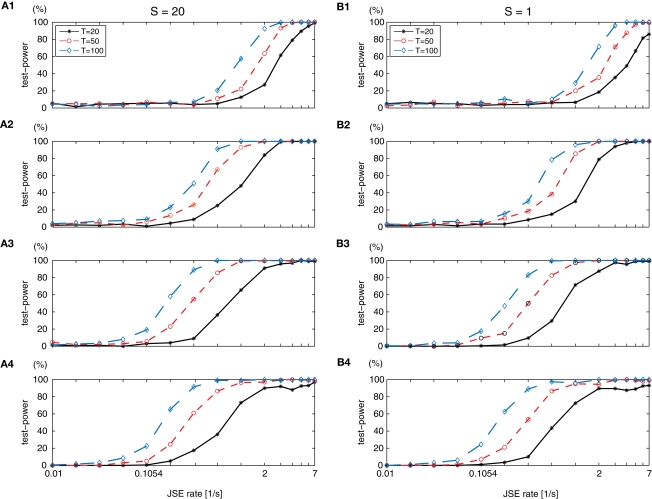
Synchronous neuronal firing has been proposed as a potential neuronal code. To determine whether synchronous firing is really involved in different forms of information processing, one needs to directly compare the amount of synchronous firing due to various factors, such as different experimental or behavioral conditions. In order to address this issue, we present an extended version of the previously published method, NeuroXidence. The improved method incorporates bi- and multivariate testing to determine whether different factors result in synchronous firing occurring above the chance level. We demonstrate through the use of simulated data sets that bi- and multivariate NeuroXidence reliably and robustly detects joint-spike-events across different factors.

Keywords: NeuroXidence; bivariate; factor; joint-spike-event; modulation of synchrony; multivariate; synchronous firing.


Figures

Figure 1
Figure 1
Detection of synchronized firing patterns. (A,B) Numerals 1–3 stand for three neurons or three neuronal populations. The right sub-panel shows the spike trains. Synchronized spikes (marked in green) are defined as joint-spike-events (JSE). (A) The three units are not coupled, so the spike trains exhibit synchronized spikes that occur at the chance level (indicated by dashed green lines). (B) A third-order coupling between three units. (C) A schematic description of a JSE. Spikes, which are defined as belonging to the same JSE, share overlapping regions within the maximally allowed jitter (τc). Modified from a previously published figure (Pipa et al., 2008).
Figure 2
Figure 2
Scenario I: Percentage of false-positives estimated by bivariate NeuroXidence in the detection of JS-patterns of complexity 2 to 6 between two models with covarying firing rates. A comparison of (A) the means and (B) the medians for a test level of 5%, and a comparison of (C) the means and (D) the medians for a test level of 1%. t-Tests are used to compare the means, and Mann–Whitney U tests are used to test the medians. The standard set of parameters for scenario I is defined by 50 trials (T), a mean spike rate of 15 spikes/s (r), 20 surrogates samples (S), and η equal to 5. From the standard parameter set, 15 different combinations of parameters are derived by using all combinations of the number of trials (T = 20, 50, 100) and the mean covarying spiking rates (r1 = r2 = 7, 10, 30, 60, 90 spikes/s).
Figure 3
Figure 3
Scenario II: Percentage of false-positives estimated by bivariate NeuroXidence in the detection of JS-patterns of complexity 2 to 6 between two models with different firing rates. A comparison of (A) the means and (B) the medians for a test level of 5%, and a comparison of (C) the means and (D) the medians for a test level of 1%. t-Tests are used to compare the means, and Mann–Whitney U tests are used to test the medians. The standard set of parameters for scenario II is defined by 50 trials (T), a mean spike rate of 15 spikes/s (r), one surrogate sample (S), and η equal to 5. From the standard parameter set, 15 different combinations of parameters are derived by using all combinations of the number of trials (T = 20, 50, 100) and the second mean spiking rate (r1 = 15, r2 = 7, 10, 30, 60, 90 spikes/s).
Figure 4
Figure 4
Test power of bivariate NeuroXidence in relation to the number of trials (T), spike rate (r), and number of surrogates (S). Rows 1–4 show the test-power dependencies on the complexities of the analyzed JS-patterns with complexities from 2 to 5. (A1–A4) Variations in the number of trials T, (B1–B4) variations in the background spike rate r, and (C1–C4) variations in the number of surrogates S from the standard parameter set (T = 50, r = 15 spikes/s, S = 20, η = 5, l = 200 ms).
Figure 5
Figure 5
Test power of bivariate NeuroXidence for an induced mother-pattern and its sub- and supra-patterns. Two simulated data sets were generated as two different conditions. Each sub-figure shows the gray-coded test power of a certain mother-pattern, all sub-patterns of lower complexities, and all supra-patterns of higher complexities. The excess rate of JSEs in one condition, which corresponds to the mother-pattern, is given on the x-axis. The standard parameters were chosen as T = 50 trials, background spike rate r = 15 spikes/s, S = 20 surrogates, and η = 5. (A–D) Shows the variations of mother-patterns with complexity 2–7.
Figure 6
Figure 6
False-positives for two non-stationary processes evaluated by bivariate NeuroXidence. Two simulated data sets are generated and each consists of 50 trials of 18 simultaneous spike trains. (A) Two simulated data sets consist of 11 periods, each 2 s in length. Each period is modeled by different features, which are used to generate the spike trains. An inhomogeneous and independent Poisson process was used as a standard model, and three additional features were added as modifications. Feature a (period 11) describes the changing rates across trials and neurons, such that neurons 1–9 were modeled by a homogenous Poisson process with a background rate of 15 spikes/s, while the rates of neurons 10–18 changed from trial-to-trial from 15 to 30 spikes/s. Feature b (periods 8, 10) indicates latency covariations, where the latency for each trial, for all of the neurons, varies by a random amount between 0 and 100 ms. Feature c (periods 2, 4, 7) represents inhomogeneous gamma processes, with shape factor γ = 7, instead of Poisson processes. (B) The peristimulus time histogram (PSTH) displays the rate profile of the non-stationary processes. During period 5, the spike rate is modulated from 5 to 50 spikes/s with a Gaussian shape with σ = 250 ms, and during periods 6, 7, and 8, σt = 50 ms. The spike rates in periods 9 and 10 were modulated from 5 to 30 spikes/s by a step function. (C) The number of individual JS-patterns of complexities 2–6 that were detected in each sliding window (τc = 5 ms, “SW” = sliding window = 800 ms). (D) The percentage of JS-patterns that show significantly different occurrence frequencies between the two conditions (test level 5%).
Figure 7
Figure 7
Scenario I: Percentage of false-positives estimated by multivariate NeuroXidence in the detection of JS-patterns of complexity 2 to 6 among six models with covarying firing rates. A comparison of (A) the means and (B) the medians for a test level of 5%, and a comparison of (C) the means and (D) the medians for a test level of 1%. ANOVAs are used to compare the means, and Kruskal–Wallis U tests are used to test the medians. The standard set of parameters is defined by 50 trials (T), a mean spike rate of 15 spikes/s (r), 20 surrogates samples (S), and η equals 5. From the standard parameter set, eight different combinations of parameters were derived by varying, in turn, the number of trials (T = 20, 50, 100) and the mean spiking rates (r1 = r2 = r3 = r4 = r5 = r6 = 7, 10, 30, 60, 90 spikes/s).
Figure 8
Figure 8
Scenario II: Percentage of false-positives estimated by multivariate NeuroXidence in the detection of JS-patterns of complexity 2 to 6 among six models with partially covarying firing rates. A comparison of (A) the means and (B) the medians for a test level of 5%, and a comparison of (C) the means and (D) the medians for a test level of 1%. ANOVAs are used to compare the means, and Kruskal–Wallis U tests are used to test the medians. The standard set of parameters is defined by 50 trials (T), a mean spike rate of 15 spikes/s (r), one surrogate sample (S), and η equals 5. From the standard parameter set, eight different combinations of parameters were derived by varying, in turn, the number of trials (T = 20, 50, 100) and the second through sixth mean spiking rates (r1 = 15, r2 = r3 = r4 = r5 = r6 = 7, 10, 30, 60, 90 spikes/s).
Figure 9
Figure 9
Test power of multivariate NeuroXidence in relation to the number of trials (T) and the number of surrogates (S). One simulated data set was modeled as a single-interaction process based on a Poisson process, while the other five simulated data sets were generated by independent and homogenous Poisson processes. Rows 1–4 show the test-power dependencies on the complexities of the analyzed JS-patterns with complexities from 2 to 5. (A1–A4) variations in the number of trials T with the number of surrogates S = 20, and (B1–B4) variations in the number of trials T with the number of surrogates S = 1, from a standard parameter set (T = 50 trials, background spike rate of r = 15 spikes/s, and η = 5.

Similar articles

References

    1. Aertsen A., Diesmann M., Gewaltig M. O., Grün S., Rotter S. (2001). “Neural dynamics in cortical networks – precision of joint-spiking events,” in Comlexity in Biological Information Processing: Novartis Foundation Symposium, eds Bock G. R., Goode J. A. (Chichester: John Wiley & Sons, Ltd.), 239, 193–204 - PubMed
    1. Baker S. N., Gerstein G. L. (2001). Determination of response latency and its application to normalization of cross-correlation measures. Neural Comput. 13, 1351–137710.1162/08997660152002889 - DOI - PubMed
    1. Baker S. N., Lemon R. N. (2000). Precise spatiotemporal repeating patterns in monkey primary and supplementary motor areas occur at chance levels. J. Neurophysiol. 84, 1770–1780 - PubMed
    1. Barlow H. B. (1972). Single units and sensation: a neuron doctrine for perceptual psychology? Perception 1, 371–39410.1068/p010371 - DOI - PubMed
    1. Bialek W., Rieke F. (1992). Reliability and information transmission in spiking neurons. Trends Neurosci. 15, 428–43410.1016/0166-2236(92)90005-S - DOI - PubMed

LinkOut - more resources