

Evidence for distinct histologic profile of nasal polyps with and without eosinophilia
- PMID: 21898422
- PMCID: PMC3183261
- DOI: 10.1002/lary.21969
Evidence for distinct histologic profile of nasal polyps with and without eosinophilia
Abstract
Objective/hypothesis: To evaluate the histology, RNA, and protein signatures of nasal polyps (NPs) in order to demonstrate specific subtypes of disease and differentiate "idiopathic" NPs based on tissue eosinophilia.
Study design: Prospective laboratory-based study.
Methods: NP tissue was obtained from patients referred to the University of Virginia Health System for sinus surgery. Histology analyses included hematoxylin-eosin, Gomori's trichrome, toluidine blue, and chloroacetate staining. RNA and protein were extracted from tissue and cytokine transcript or protein concentrations determined.
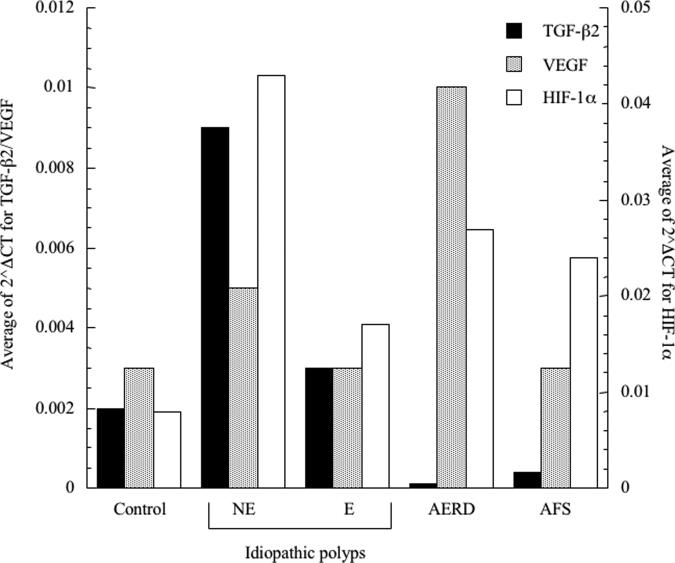
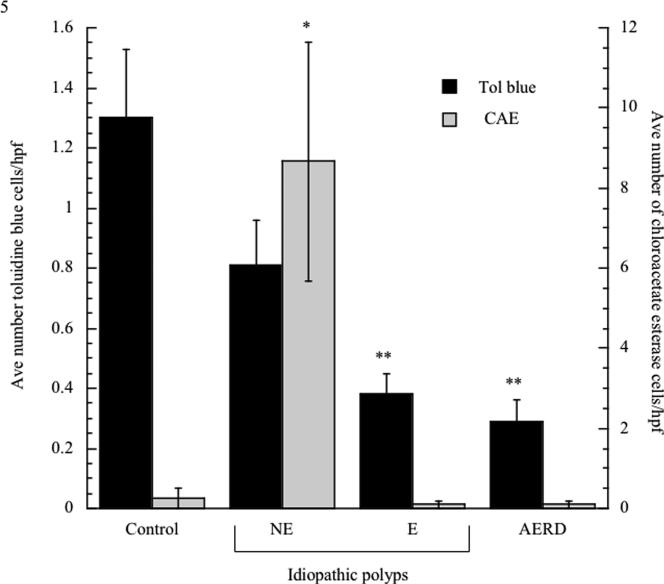
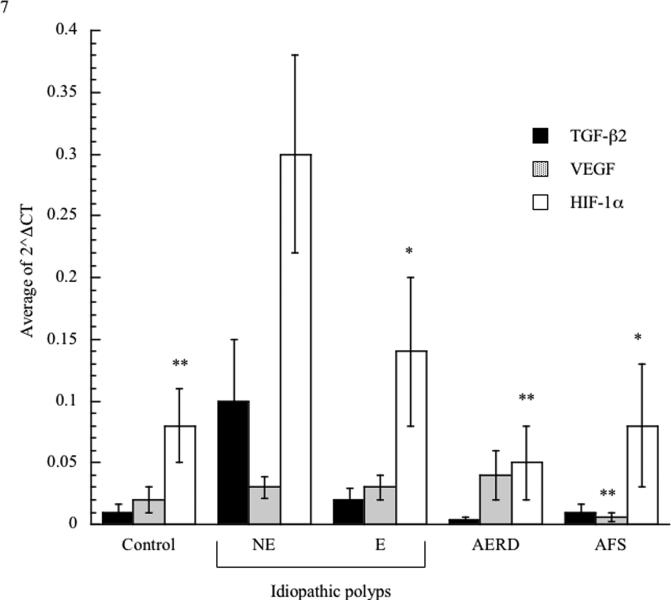
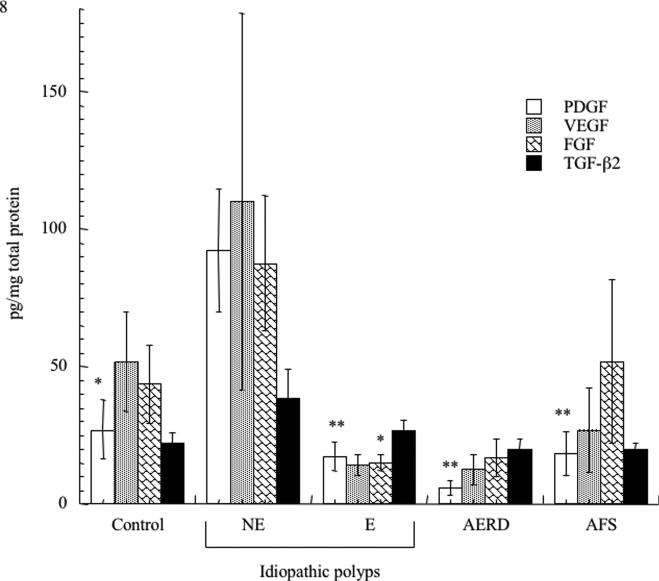
Results: Idiopathic NPs can be divided into distinct subsets characterized by absence (NE) and presence (E) of prominent eosinophilia. The validity of this distinction is supported by the demonstration that NE polyps are further distinguished by glandular hypertrophy, dense collagen deposition, and mononuclear cellular infiltrate. In contrast, E-NP display edema, rare glandularity, and minimal collagen deposition except within the basement membrane. Total mast cell numbers were reduced in E-NP, whereas connective tissue mast cells were increased in NE-NP. Consistent with the distinctive pattern of increased fibrosis, NE-NP displayed increased transforming growth factor-β and vascular endothelial growth factor transcripts. Similarly, NE-NPs had higher concentrations of transforming growth factor-β, fibroblast growth factor-β, and platelet-derived growth factor protein.
Conclusions: Idiopathic NPs can be distinguished by NE and E and are supported by the observations that these display distinct histologic, gene, and protein expression patterns. The findings suggest that as unique diseases, idiopathic NPs will require distinct therapeutic interventions.
Copyright © 2011 The American Laryngological, Rhinological, and Otological Society, Inc.
Figures

References
-
- Polzehl D, Moeller P, Riechelmann H, Perner S. Distinct features of chronic rhinosinusitis with and without nasal polyps. Allergy. 2006;61:1275–9. - PubMed
-
- Berger G, Kattan A, Bernheim J, Ophir D. Polypoid mucosa with eosinophilia and glandular hyperplasia in chronic sinusitis: a histopathological and immunohistochemical study. Laryngoscope. 2002;112:738–45. - PubMed
-
- Early SB, Han JW, Borish L, J. S. Histologic examination reveals distinct disease subsets of chronic sinusitis. J Allergy Clin Immunol. 2007;119:S243.
-
- Schubert MS, Goetz DW. Evaluation and treatment of allergic fungal sinusitis. I. Demographics and diagnosis. J Allergy Clin Immunol. 1998;102:387–94. - PubMed
Publication types
MeSH terms
Substances
Grants and funding
LinkOut - more resources
Full Text Sources
Medical
Miscellaneous
