

Early changes in interferon signaling define natural killer cell response and refractoriness to interferon-based therapy of hepatitis C patients
- PMID: 21898483
- PMCID: PMC3353526
- DOI: 10.1002/hep.24628
Early changes in interferon signaling define natural killer cell response and refractoriness to interferon-based therapy of hepatitis C patients
Abstract
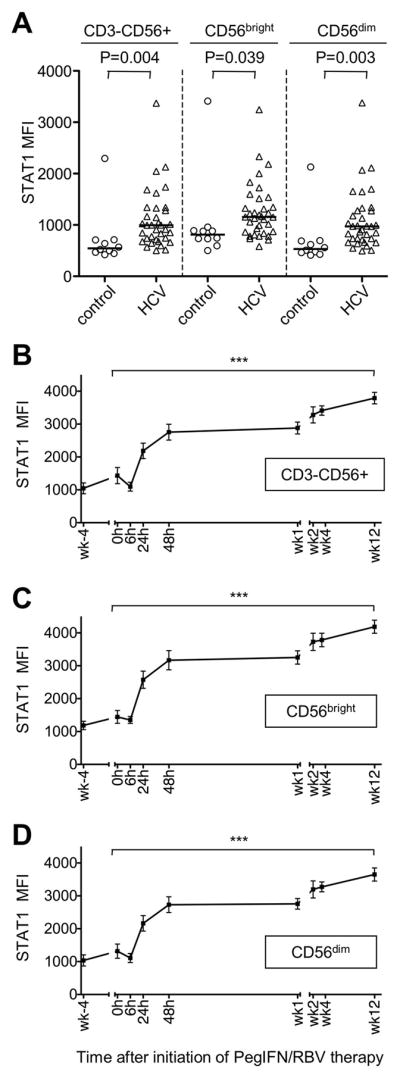
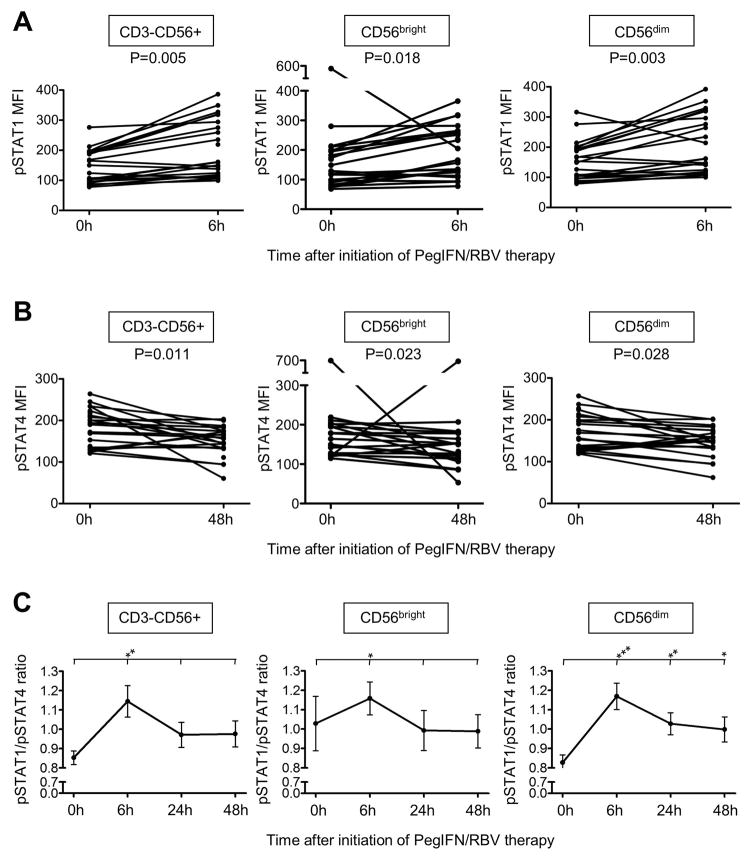
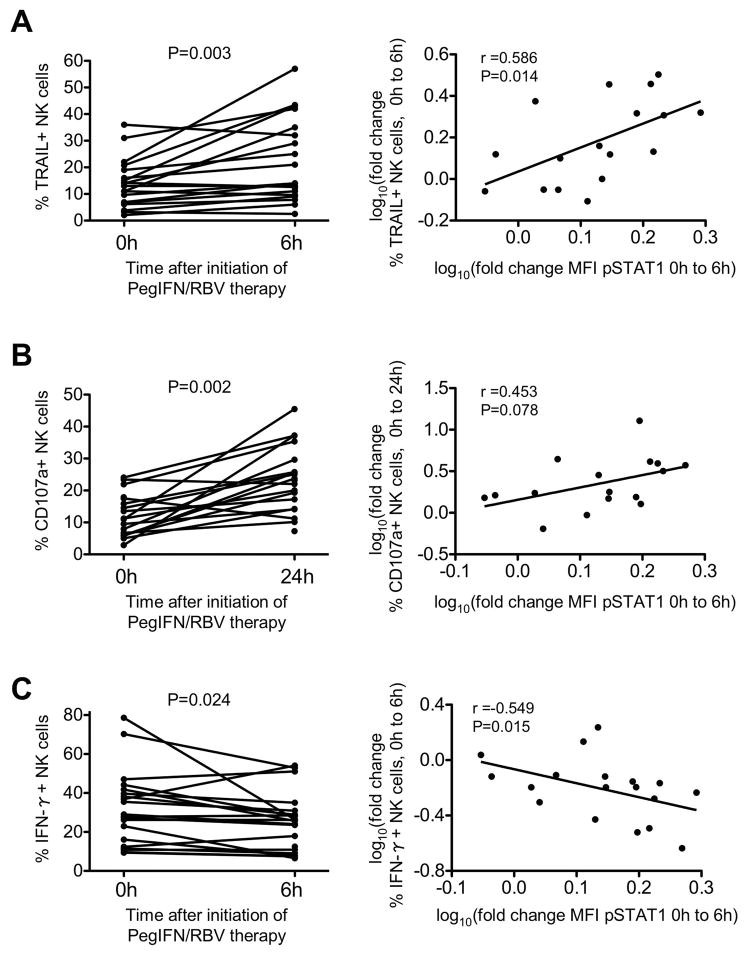
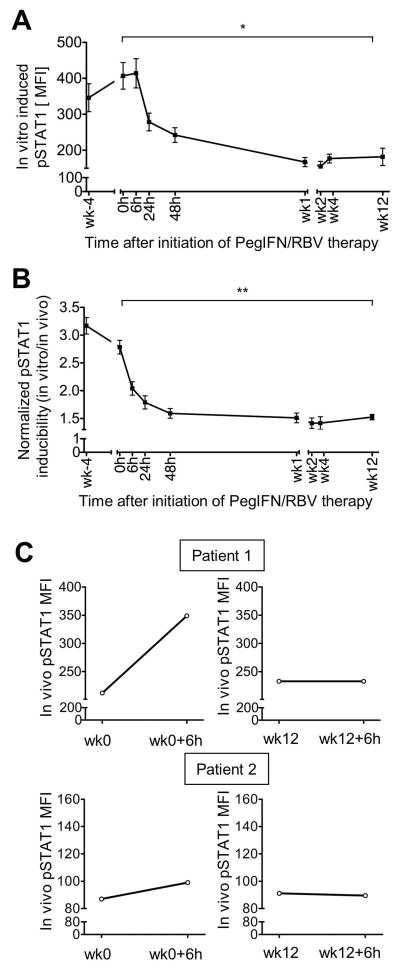
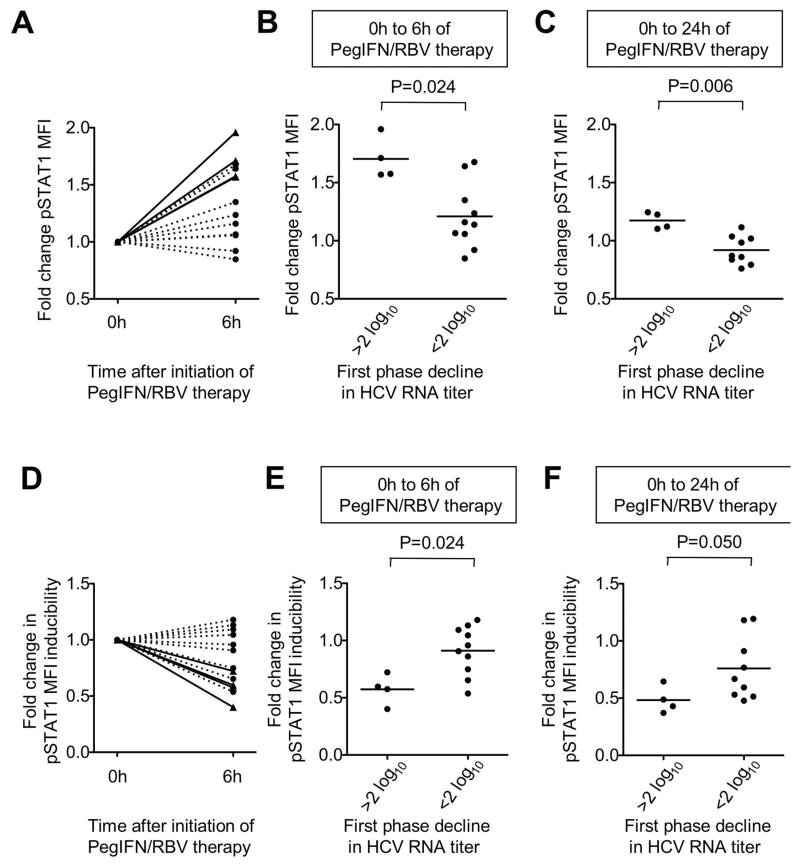
Natural killer (NK) cells exhibit a polarized phenotype with increased cytotoxicity and decreased interferon gamma (IFN-γ) production in chronic hepatitis C virus (HCV) infection. Here, we asked whether this is caused by type I interferon (IFN)-induced expression and phosphorylation levels of signal transducer and activator of transcription (STAT) molecules in NK cells and whether it affects the response and refractoriness of NK cells to IFN-α-based therapy of HCV. STAT1 levels in NK cells were significantly higher in patients with chronic HCV infection than in uninfected controls. STAT1 levels and induction of phosphorylated STAT1 (pSTAT1) increased further during IFN-α-based therapy with preferential STAT1 over STAT4 phosphorylation. Induction of pSTAT1 correlated with increased NK cytotoxicity (tumor necrosis factor-apoptosis-inducing ligand [TRAIL] expression and degranulation) and decreased IFN-γ production. NK cells from patients with a greater than 2 log(10) first-phase HCV RNA decline to IFN-α-based therapy (>99% IFN effectiveness) displayed strong pSTAT1 induction in vivo and were refractory to further stimulation in vitro. In contrast, NK cells from patients with a less than 2 log(10) first-phase HCV RNA decline exhibited lower pSTAT1 induction in vivo (P = 0.024), but retained greater IFN-α responsiveness in vitro (P = 0.024). NK cells of all patients became refractory to in vivo and in vitro stimulation by IFN-α during the second-phase virological response.
Conclusion: These data show that IFN-α-induced modulation of STAT1/4 phosphorylation underlies the polarization of NK cells toward increased cytotoxicity and decreased IFN-γ production in HCV infection, and that NK cell responsiveness and refractoriness correlate to the antiviral effectiveness of IFN-α-based therapy.
Copyright © 2011 American Association for the Study of Liver Diseases.
Figures
Similar articles
-
Ribavirin improves the IFN-γ response of natural killer cells to IFN-based therapy of hepatitis C virus infection.Hepatology. 2014 Oct;60(4):1160-9. doi: 10.1002/hep.27092. Epub 2014 Aug 13. Hepatology. 2014. PMID: 24700342 Free PMC article. Clinical Trial.
-
Rapid decrease in hepatitis C viremia by direct acting antivirals improves the natural killer cell response to IFNα.Gut. 2017 Apr;66(4):724-735. doi: 10.1136/gutjnl-2015-310033. Epub 2016 Jan 4. Gut. 2017. PMID: 26733671 Free PMC article.
-
Altered interferon-alpha-signaling in natural killer cells from patients with chronic hepatitis C virus infection.J Hepatol. 2010 Sep;53(3):424-30. doi: 10.1016/j.jhep.2010.03.018. Epub 2010 May 25. J Hepatol. 2010. PMID: 20554341
-
Control of HCV Infection by Natural Killer Cells and Macrophages.Cold Spring Harb Perspect Med. 2020 Sep 1;10(9):a037101. doi: 10.1101/cshperspect.a037101. Cold Spring Harb Perspect Med. 2020. PMID: 31871225 Free PMC article. Review.
-
Interferon-gamma: biologic functions and HCV terapy (type I/II) (2 of 2 parts).Clin Ter. 2006 Sep-Oct;157(5):457-68. Clin Ter. 2006. Retraction in: Clin Ter. 2008 May-Jun;159(3):208. PMID: 17147054 Retracted. Review.
Cited by
-
RNA Sequencing Analysis of Patients with Chronic Hepatitis B Treated Using PEGylated Interferon.Int J Gen Med. 2024 Oct 1;17:4465-4474. doi: 10.2147/IJGM.S474284. eCollection 2024. Int J Gen Med. 2024. PMID: 39372134 Free PMC article.
-
Therapeutic depletion of natural killer cells controls persistent infection.J Virol. 2014 Feb;88(4):1953-60. doi: 10.1128/JVI.03002-13. Epub 2013 Nov 27. J Virol. 2014. PMID: 24284324 Free PMC article.
-
Viral (hepatitis C virus, hepatitis B virus, HIV) persistence and immune homeostasis.Immunology. 2014 Nov;143(3):319-30. doi: 10.1111/imm.12349. Immunology. 2014. PMID: 24965611 Free PMC article. Review.
-
IFN-λ: A New Class of Interferon with Distinct Functions-Implications for Hepatitis C Virus Research.Gastroenterol Res Pract. 2015;2015:796461. doi: 10.1155/2015/796461. Epub 2015 May 20. Gastroenterol Res Pract. 2015. PMID: 26078754 Free PMC article. Review.
-
Interferon- α -Induced Changes to Natural Killer Cells Are Associated with the Treatment Outcomes in Patients with HCV Infections.Hepat Res Treat. 2013;2013:374196. doi: 10.1155/2013/374196. Epub 2013 Aug 13. Hepat Res Treat. 2013. PMID: 23997950 Free PMC article.
References
-
- Billiau A, Matthys P. Interferon-gamma: a historical perspective. Cytokine Growth Factor Rev. 2009;20:97–113. - PubMed
Publication types
MeSH terms
Substances
Grants and funding
LinkOut - more resources
Full Text Sources
Molecular Biology Databases
Research Materials
Miscellaneous