. 2012 Jan;55(1):233-43.
doi: 10.1002/hep.24631.

Genetic interactions between hepatocyte nuclear factor-6 and Notch signaling regulate mouse intrahepatic bile duct development in vivo

Affiliations

Genetic interactions between hepatocyte nuclear factor-6 and Notch signaling regulate mouse intrahepatic bile duct development in vivo

Charles Vanderpool et al. Hepatology. 2012 Jan.

Abstract

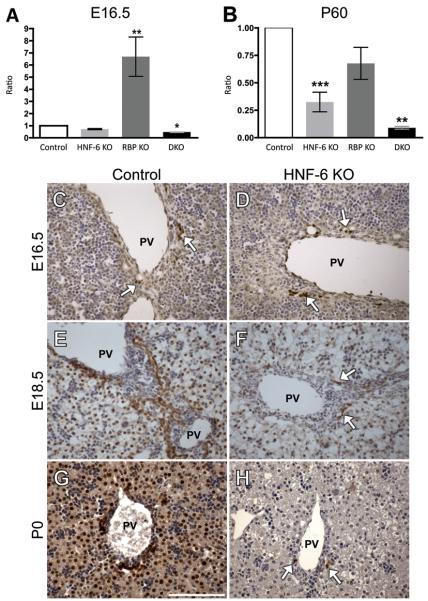
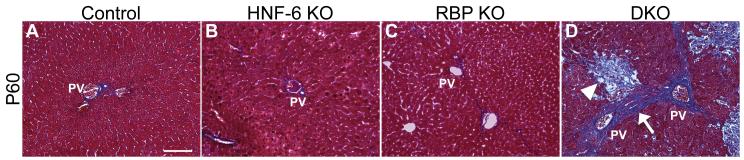
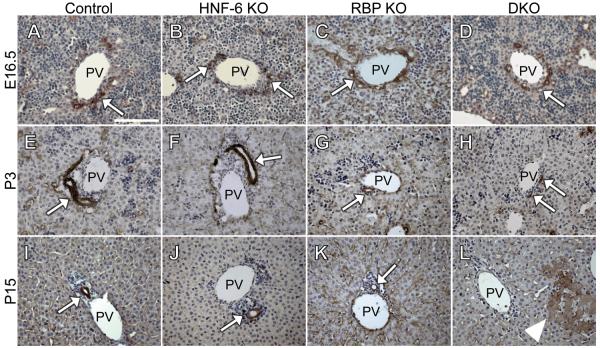
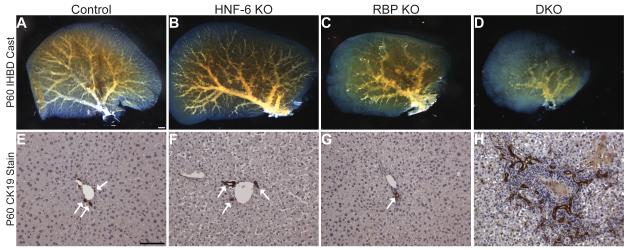
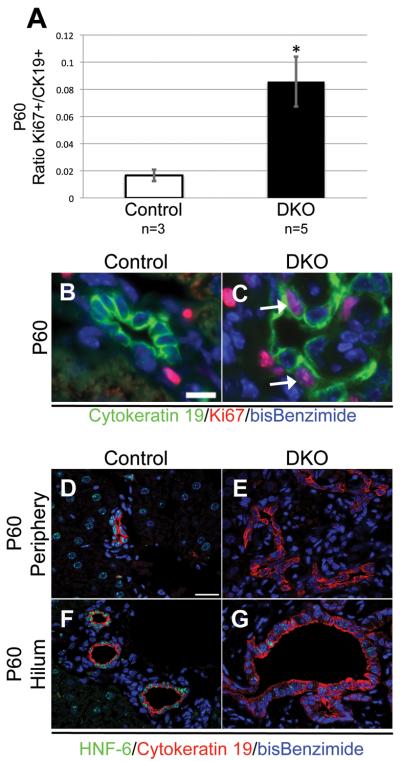
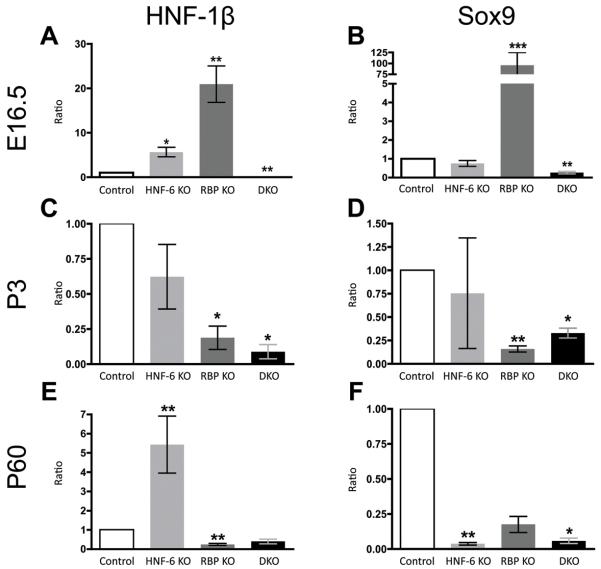
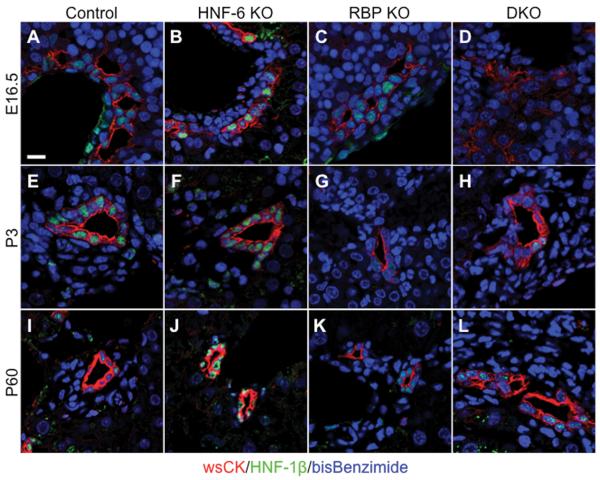
Notch signaling and hepatocyte nuclear factor-6 (HNF-6) are two genetic factors known to affect lineage commitment in the bipotential hepatoblast progenitor cell (BHPC) population. A genetic interaction involving Notch signaling and HNF-6 in mice has been inferred through separate experiments showing that both affect BHPC specification and bile duct morphogenesis. To define the genetic interaction between HNF-6 and Notch signaling in an in vivo mouse model, we examined the effects of BHPC-specific loss of HNF-6 alone and within the background of BHPC-specific loss of recombination signal binding protein immunoglobulin kappa J (RBP-J), the common DNA-binding partner of all Notch receptors. Isolated loss of HNF-6 in this mouse model fails to demonstrate a phenotypic variance in bile duct development compared to control. However, when HNF-6 loss is combined with RBP-J loss, a phenotype consisting of cholestasis, hepatic necrosis, and fibrosis is observed that is more severe than the phenotype seen with Notch signaling loss alone. This phenotype is associated with significant intrahepatic biliary system abnormalities, including an early decrease in biliary epithelial cells, evolving to ductular proliferation and a decrease in the density of communicating peripheral bile duct branches. In this in vivo model, simultaneous loss of both HNF-6 and RBP-J results in down-regulation of both HNF-1β and Sox9 (sex determining region Y-related HMG box transcription factor 9).

Conclusion: HNF-6 and Notch signaling interact in vivo to control expression of downstream mediators essential to the normal development of the intrahepatic biliary system. This study provides a model to investigate genetic interactions of factors important to intrahepatic bile duct development and their effect on cholestatic liver disease phenotypes.


Figures

Fig. 1
Fig. 1. Alb-Cre mediated recombination results in deletion of HNF-6
(A-B) The relative expression ratio of HNF-6 mRNA was calculated using real-time RT-PCR and the deviation in cycle threshold (Ct) of control (without Alb-Cre), HNF-6 KO, RBP KO, and DKO samples and is expressed in comparison to GAPDH (Glyceraldehyde 3-phosphate dehydrogenase) at ages E16.5 and P60. A minimum of 3 RNA samples from separate mice were tested for each genotype. Statistical analysis was performed using a two-tailed Student’s t-test. Error bars represent standard error of the mean. *P<0.05, **P<0.01, ***P<0.001 (C-H) Immunostaining for HNF-6 protein in paraffin sections counterstained with Mayer’s hematoxylin in control and HNF-6 KO genotypes at ages E16.5, E18.5, and P0. (C-D) HNF-6 protein expression is similar in control and HNF-6 KO mice at E16.5, largely limited to periportal BECs. HNF-6 protein is visibly decreased compared to control by E18.5 (E-F) as well as P0 (G-H) in HNF-6 KO mice, with arrows representing the HNF-6 immuno-positive areas within this field limited to scattered periportal BECs surrounding larger hilar portal veins, confirming that Alb-Cre mediated recombination at the HNF-6 locus occurs prior to birth. (G) Scale bar = 100μm.
Fig. 2
Fig. 2. Loss of HNF-6 and RBP-J results in hepatic fibrosis and necrosis
(A-D) Representative paraffin sections from P60 mice stained for collagen with Gomori one-step trichrome stain. Genotypes are designated within figure. Age-matched control mice without Alb-Cre transgene were used for comparison. Images were obtained from the periphery of the left liver lobe. (A-C) Collagen deposition did not visibly differ compared to control with isolated loss of HNF-6 or RBP-J. (D) With loss of both HNF-6 and RBP-J, bridging fibrosis with collagen deposition (arrow) between portal veins, as well as extensive hepatic necrosis (arrowhead), was observed. PV, portal vein. (A) Scale bar = 100μm.
Fig. 3
Fig. 3. Decrease in early postnatal wsCK+ BECs upon loss of both HNF-6 and RBP-J
Paraffin sections from control (A,E,I), HNF-6 KO (B,F,J), RBP KO (C,G,K), and DKO (D,H,L) were immunostained for wsCK to mark BECs and counterstained with Mayer’s hematoxylin. HNF-6 KO mice showed no phenotypic variance in wsCK+ BECs compared to control at all ages evaluated (B,F,J). At E16.5, both RBP KO (C) and DKO (D) demonstrate wsCK+ cells (arrow) contributing to a ductal plate surrounding the portal vein similar to control (A). At P3, in RBP KO (G) and DKO mice (H), there are fewer wsCK+ BECs (arrow) compared to control (E) with DKO mice showing fewer formed ductal structures compared to RBP KO mice. At P15, while RBP KO mice show fewer formed ducts compared to control (K, arrow) there is complete absence of peripheral wsCK+ BECs in DKO mice (L, n=5) while control and HNF-6 KO mice show formed luminal ductal structures (I,J, arrow). In DKO mice at P15, portal veins were identified by surrounding mesenchymal cells, which are not present around central veins. Hepatic necrosis (L, arrowhead) was also present at P15 in DKO mice. PV, portal vein. Scale bar = 100μm.
Fig. 4
Fig. 4. Severe decrease in communicating peripheral IHBDs with loss of HNF-6 and RBP-J
Liquid resin/catalyst mix was retrograde injected into the common bile duct to obtain a cast of the communicating intrahepatic biliary architecture (A-D) in P60 mice, with images representative of entire left lobe cleared with BABB. (E-H) Corresponding paraffin sections from mice of equal genotype and age, immunostained for CK19 to mark BECs and counterstained with Mayer’s hematoxylin. Images obtained from periphery of left lobe. (A) Control (littermates without Alb-Cre transgene, n=3). (B) HNF-6 KO (n=5). (C) RBP KO (n=6). (D) DKO (n=8). While loss of RBP-J leads to a decrease in communicating peripheral IHBDs cast branches (C) and peripheral bile duct paucity (G), loss of both HNF-6 and RBP-J leads to a more severe decrease in communicating peripheral IHBD cast branches (D) yet an increase in the number of CK19+ BECs surrounding portal veins at P60 (H). (A) Scale bar = 1 mm. (E) Scale bar = 100 μm. (E-G) Arrow, CK19+ ductal structures.
Fig. 5
Fig. 5. A proliferative cytokeratin-positive reactive population arises in adult mice with loss of both HNF-6 and RBP-J
(A) The ratio of double Ki67/CK19+ to total CK19+ cells counted per mouse. A minimum of 354 total CK19+ cells were counted from each control mouse (n=3), with a total of 1390 CK19+ cell counted for control. A minimum of 531 total CK19+ cells were counted from each DKO mouse (n=5), with a total of 4126 CK19+ cells counted for DKO. CK19+ BECs in DKO mice have a significantly increased proliferation ratio compared to control mice. Statistical analysis was performed using a two-tailed Student’s t-test comparing proliferative ratios of separate mice. * P < 0.05. (B-C) Representative paraffin sections from the periphery of the left lobe in P60 control and DKO mice stained for Ki67 protein as a cellular marker for proliferation and CK19 as a marker for BECs. (B) Scale bar = 10 μm. (C) Arrow, dual labeled cell for Ki67 and CK19. (D-G) Paraffin sections from the left lobe in P60 Control and DKO mice stained for HNF-6 and CK19. (D-E) Periphery of left lobe. (F-G) Hilum of left lobe. Reactive peripheral ductal cells in DKO mice (E) remain negative for HNF-6 protein, while only limited hilar cells in DKO mice (G) stain positive for HNF-6 protein compared to control (D,F). (D) Scale bar = 20 μm.
Fig. 6
Fig. 6. Alteration in HNF-1β and Sox9 mRNA expression with loss of HNF-6 and RBP-J
The relative expression ratio of HNF-1β (A,C,E) and Sox9 (B,D,F) mRNA was calculated using real-time RT-PCR. The deviation in cycle threshold (Ct) of experimental (HNF-6 KO, RBP KO, and DKO mice) versus control (without Alb-Cre) total liver samples are expressed in comparison to GAPDH (Glyceraldehyde 3-phosphate dehydrogenase) at ages E16.5 (A,B), P3 (C,D), and P60 (E,F). (A,B) At E16.5, expression of both HNF-1β and Sox9 is decreased only in DKO mice. (C,D) Expression of both factors remains decreased at P3 in DKO mice. HNF-1β and Sox9 expression are also decreased in RBP KO mice at P3. (E,F) At P60, Sox9 expression remains decreased in DKO mice while HNF-1β expression does not differ significantly from control. A minimum of 3 samples from separate mice were analyzed for each genotype at each age group. Statistical analysis was performed using a two-tailed Student’s t-test. Error bars represent standard error of the mean. *P<0.05, **P<0.01, ***P<0.001.
Fig. 7
Fig. 7. Alteration in HNF-1β protein expression with loss of HNF-6 and RBP-J
Representative paraffin sections from the left lobe of control (A,E,I), HNF-6 KO (B,F,J), RBP KO (C,G,K), and DKO mice (D,H,L) immunofluorescent stained for wsCK and HNF-1β. HNF-1β protein expression generally mirrored that of RNA expression profile. HNF-1β protein localization was visible in HNF-6 KO (B) and RBP KO (C), albeit lower in DKO (D) compared to control (A) at age E16.5. At P3, HNF-1β protein was visibly decreased in both RBP KO (G) and DKO mice (H) compared to control (E) peripheral ducts. At P60, HNF-1β was present in some ducts although there are fewer ducts in RBP KO mice (K). In DKO mice (L), HNF-1β protein staining appeared similar to control (I) at P60. HNF-6 KO mice (J) showed an increase in HNF-1β protein compared to control. (A) Scale bar = 10μm.

References

    1. Chiba S. Notch signaling in stem cell systems. Stem Cells. 2006;24:2437–2447. - PubMed
    1. Kopan R, Ilagan MX. The canonical Notch signaling pathway: unfolding the activation mechanism. Cell. 2009;137:216–233. - PMC - PubMed
    1. Li L, Krantz ID, Deng Y, Genin A, Banta AB, Collins CC, Qi M, et al. Alagille syndrome is caused by mutations in human Jagged1, which encodes a ligand for Notch1. Nat Genet. 1997;16:243–251. - PubMed
    1. Oda T, Elkahloun AG, Pike BL, Okajima K, Krantz ID, Genin A, Piccoli DA, et al. Mutations in the human Jagged1 gene are responsible for Alagille syndrome. Nat Genet. 1997;16:235–242. - PubMed
    1. McDaniell R, Warthen DM, Sanchez-Lara PA, Pai A, Krantz ID, Piccoli DA, Spinner NB. NOTCH2 mutations cause Alagille syndrome, a heterogeneous disorder of the notch signaling pathway. Am J Hum Genet. 2006;79:169–173. - PMC - PubMed

Publication types

MeSH terms