Review
. 2011 Nov 9;111(11):7315-54.
doi: 10.1021/cr2000477. Epub 2011 Sep 7.

Materials and transducers toward selective wireless gas sensing

Affiliations
Review

Materials and transducers toward selective wireless gas sensing

Radislav A Potyrailo et al. Chem Rev. .
No abstract available


Figures

Figure 1
Figure 1
Examples of regulated vapor-exposure limits established by different organizations:
  1. GPL: General Population Limit, established by USACHPPM – U.S. Army Center for Health Promotion and Preventative Medicine;

  2. PEL: Permissible Exposure Limit, established by OSHA, Occupational Safety and Health Administration;

  3. TLV-STEL: Threshold Limit Value (Short Term Exposure Limit) and TLV-TWA: Threshold Limit Value (Time Weighted Average), established by ACGIH, American Conference of Governmental Industrial Hygenists;

  4. IDLH: Immediately Dangerous to Life or Health and LOC: Level of Concern, 0.1×IDLH, established by NIOSH, U.S. National Institute for Occupational Safety and Health;

  5. AEGL-1,2,3: Acute Exposure Guideline Levels, established by EPA – U.S. Environmental Protection Agency.

Figure 2
Figure 2
Number of publications on wireless sensors (as searched in Inspec and Scopus databases).
Figure 3
Figure 3
Subsystem schematic of a typical wireless sensor and its wireless communication with a sensor reader/display.
Figure 4
Figure 4
Examples of battery-free (passive) wireless sensors based on (a) magnetoelastic, (b) thickness shear mode, (c) surface acoustic wave, and (d) resonant inductor–capacitor-resistor transducers. Figure 5d is photo courtesy of K. G. Ong (Michigan Technological University), used by permission. (a) Reprinted with permission from reference. Copyright 2007 IEEE.
Figure 5
Figure 5
Examples of active and passive RFID sensors. Active sensors with (a) thin-film and (b) AAA-type batteries. Passive sensors with an analog input into an IC memory chip for operation at (c), LF (d), HF and (e) UHF frequency ranges; (f) passive sensor based on a common HF RFID tag with a sensing material applied directly to the resonant antenna of the sensor. Figures 5c–d are courtesy of Phase IV Engineering, Inc., used by permission. Figure 5e is courtesy of Schneider Electric, used by permission.
Figure 6
Figure 6
Typical response cross-sensitivity of different types of sensing materials to a variety of vapors: (a) capacitance response pattern of single-wall carbon nanotubes and (b) resistance response pattern of LiMo3Se3 nanowires. (a) Reprinted with permission from reference. Copyright 2005 AAAS. (b) Reprinted with permission from reference. Copyright 2005 American Chemical Society.
Figure 7
Figure 7
Operation of sensor arrays for detection of several components in gas mixtures depicted as scores plots from principal components analysis. (a) Monte Carlo simulated response of a sensor array to three individual vapors A, B, and C and their binary and ternary mixtures. Sensor array responses were normalized by dividing each response by the sum of the responses from all sensors for a given vapor or vapor mixture. (b) Response of an array of 10 chemiresistors coated with diverse surface-functionalized single wall carbon nanotubes sensing films upon exposure to two types of vapor mixtures (X, green squares and Y, red circles) at 0 and 80 % RH. (a) Reprinted with permission from reference. Copyright 2004 American Chemical Society. (b) Reprinted with permission from reference. Copyright 2008 American Chemical Society.
Figure 8
Figure 8
The operating principle of passive battery-free RFID sensors with multivariable response: (a) Sensing material is applied onto the resonant antenna of the RFID tag. (b) Complementary sensor is attached across an antenna and memory chip. In both cases (a, b) the electrical response of the sensing material is translated into changes in the impedance response of the sensor. (c) Measured impedance spectrum (real part Zre(f) and imaginary part Zim(f) of impedance) and examples of parameters for multivariate analysis: frequency position Fp and magnitude Zp of Zre(f) and resonant F1 and antiresonant F2 frequencies of Zim(f).
Figure 9
Figure 9
General summary of research activities in development of sensing materials for transducers with different power requirements applicable for wireless sensing.
Figure 10
Figure 10
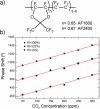
Application of a random copolymer Teflon AF2400 prepared from tetrafluoroethylene and 2,2-bis(trifluoromethyl)-4,5-difluoro-1,3-dioxole for CO2 sensing using a wireless SAW sensor. (a) Chemical structures of Teflon AF2400 and AF1600. (b) Sensor response to CO2 at different humidity levels. Reprinted with permission from reference. Copyright 2007 IOP Publishing.
Figure 11
Figure 11
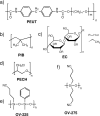
Representative examples of low-Tg polymers that became “classic” benchmark sensing materials. (a) polyetherurethane (PEUT), (b) polyisobutylene (PIB), (c) ethyl cellulose (EC), (d) polyepichlorihydrin (PECH), (e) cyanopropyl methyl phenylmethyl silicone (OV-225), and (f) dicyanoallyl silicone (OV-275).
Figure 12
Figure 12
Comparison of the ability to discriminate between three individual vapors (water, toluene, and THF) using different transducers coated with the same PEUT films: (a) Performance of a passive RFID sensor with a capacitance transducer. (b–d) Performance of an RFID sensor with multi-variable signal transduction; individual sensor responses (b) Fp, F1, F2, Fz, and (c) Zp, Z1, Z2; and (d) Scores plot of a PCA model of an individual RFID sensor response.
Figure 13
Figure 13
Demonstration of humidity-independent operation using a single RFID sensor with multivariable signal transduction and PEUT sensing polymer. (a) Plot of PC1 vs. PC2 vs. time illustrates sensor response to five concentrations of toluene vapor (0.04, 0.07, 0.10, 0.14, and 0.20 P/Po, two replicates each) at three humidity levels. (b) Multivariate calibration curves for toluene detection at 0, 20, and 40 %RH.
Figure 14
Figure 14
Quantitation of an analyte vapor (acetone) in the presence of multiple interferences (water and ethanol vapors) using a single RFID sensor with multi-variable signal transduction and PEUT sensing polymer. (a) Plot of PC1 vs. PC2 illustrates sensor response to four concentrations of acetone vapor (0.044, 0.089, 0.133, and 0.178 P/Po) at two concentrations of water vapor (0.18 and 0.36 P/Po) and two concentrations of ethanol vapor (0.09 and 0.18 P/Po). (b) Multivariate calibration curves for acetone detection in the presence of two interferences (water and ethanol vapors).
Figure 15
Figure 15
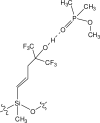
Example of selective molecular association between DMMP and the hexafluoroisopropanol group in SXFA polymer.
Figure 16
Figure 16
Combinatorial screening of sensing film compositions using passive RFID sensors. (a) Phthalate plasticizers dimethyl phthalate N1, butyl benzyl phthalate N2, di-(2-ethylhexyl) phthalate N3, dicapryl phthalate N4, and diisotridecyl phthalate N5. (b) Photo of an array of 48 RFID sensors prepared for temperature-gradient evaluations of response of Nafion/phthalate compositions. (c) Results of principal components analysis of F1, F2, Fp, and Zp responses of RFID sensors with six types of sensing films to H2O and ACN vapors upon annealing at 110 °C. Arrows illustrate the H2O – ACN Euclidean distances and the response direction of sensing films N0N5 starting with ACN and ending with H2O response. Reprinted with permission from reference. Copyright 2009 American Chemical Society.
Figure 17
Figure 17
Application of conjugated polymer compositions with diverse vapor-response mechanisms on multi-variable RFID transducers. Conjugated polymer compositions: (a) PEDOT/PSS. (c) PANI/CSA. PCA scores plots demonstrating selective analysis of vapors using individual RFID sensors with the multi-variable signal transduction. (b) Discrimination between EtOH, ACN, and H2O vapors using PEDOT-PSS film, concentrations of all vapors were 0.04, 0.07, 0.1, 0.14, and 0.2 P/Po. (d) Discrimination between NH3 and H2O vapors using PANI-CSA film, concentrations of H2O vapor were 0.02, 0.04, 0.07, 0.1, 0.14, and 0.2 P/Po and concentrations of NH3 vapor were 1×10⁻⁵, 2×10⁻⁵, 3.5×10⁻⁵, 5×10⁻⁵, 7×10⁻⁵, and 1×10⁻⁴ P/Po. Reprinted with permission from reference Copyright 2009 Wiley.
Figure 18
Figure 18
Monitoring of fish freshness using PANI-based RFID sensors. Sensors 1 – 3 were positioned in a headspace with ~ 20 g (each) of salmon filet on a water-soaked liner. Sensor 4 served as the first negative control positioned in a low humidity headspace. Sensor 5 served as the second negative control positioned in a headspace only with a water-soaked liner. Sensors 1 − 5 were monitored at once at room temperature using a multiplexed sensor reader after 1 h of equilibration time to reach the state-state condition in all four sensors. Results are plotted as means and SD for sensors 1 – 3 (red trace) and 4 – 5 (blue trace). Inset, initial response of sensors 1 – 5.
Figure 19
Figure 19
Humidity-independent operation using a conjugated polymer sensing film on a multivariable RFID transducer. (a) Structure of poly(fluorene)-diphenylpropane polymer. (b) Response to different concentrations of TCE, water, and toluene vapors. TCE and toluene vapor concentrations are 0.02, 0.03, 0.5, 0.7, and 0.1 P/Po; water concentration corresponds to relative humidity of 4, 10, 20, 48, and 76 %RH. (c) Sensor response stability to TCE vapor (P/Po = 0.1) at different RH of carrier gas.
Figure 20
Figure 20
Demonstration of morphology effects of a drop-cast regioregular poly(3-hexylthiophene) thin film on vapor-response selectivity. (a) AFM image of sensing film inside the transistor channel; (b) Contour map illustrating the effect of applied gate voltage on transistor drain-source current response to ten vapors normalized to 1 ppm of each vapor. Reprinted with permission from reference. Copyright 2008 American Chemical Society.
Figure 21
Figure 21
Representative examples of nanostructured polymeric materials employed for vapor sensing with progressively decreasing feature size. SEM images of (a) self assembled film from phenylacetylene nanospheres; reprinted with permission from reference (b) poly(2-methoxy-5-(2′-ethylhexyloxy)-1,4-phenylenevinylene nanowires fabricated by edge lithography; reprinted with permission from reference and (c) PEDOT/PSS nanowires fabricated by self-assembled block copolymer lithography., Reprinted with permission from. (a) Copyright 2008 IOP Publishing.(b) Copyright 2008 American Chemical Society (c) Copyright 2008 American Chemical Society.
Figure 22
Figure 22
SEM images of a microstructured polydiacetylene-based polymeric film (a) before and (b) after exposure to ~ 5000 ppm of dimethylformamide vapor for 10 min. Reprinted with permission from Copyright 2010 Elsevier.
Figure 23
Figure 23
Example of utilization of sensing film dewetting effects for chemical dosimetry. Atomic force micrographs of an ink-jet printed PEDOT-PSS film (a) before and (b) after exposure to ~ 5000 ppm of methanol vapor for 30 min Reprinted with permission from reference. Copyright 2005 American Institute of Physics.
Figure 24
Figure 24
SEM image of SWNTs.
Figure 25
Figure 25
Monitoring of CO2 using wireless LCR transducer coated with a MWNT-SiO2 composite film. Hysteresis-free sensor response as ε′r and ε″r upon sensor exposure to CO2 concentrations varying from 0% to 100% vol. Reprinted with permission from reference. Copyright 2001 MDPI.
Figure 26
Figure 26
Mechanism of interactions of polar gas molecules with surface-modified carbon nanotubes. Reprinted with permission from reference. Copyright 2004 IOP Publishing.
Figure 27
Figure 27
Scores plot from a 10-detector array exposed to the representative VOC biomarkers of lung cancer as well as to water (to simulate the humidity effect in the exhaled breath) at P/Po = 0.0001–0.05 in air. Reprinted with permission from reference. Copyright 2008 American Chemical Society
Figure 28
Figure 28
SEM image of graphene.
Figure 29
Figure 29
Resistivity response of pristine graphene monocrystals to 1 ppm concentrations of different reducing and oxidizing gases. Regions: (I) response in vacuum before gas exposure; (II) exposure to 1 ppm of gases; (III) gas removed by vacuum; (IV) gas desorption by annealing at 150°C. Reprinted with permission from reference. Copyright 2007 Nature Publishing Group.
Figure 30
Figure 30
Conductance response (ΔG/G0) of SWNT and graphene devices to periodic 30 s pulses of 0.5 ppb DNT. Vertical arrows in the plot mark the end of each 30 s pulse. Reprinted with permission from reference. Copyright 2008 American Chemical Society.
Figure 31
Figure 31
Dynamics of operation for a graphene sensor at variable temperatures ranging from 21 to 149 °C for detection of 5 ppm of NO2. Reprinted with permission from reference. Copyright 2009 American Chemical Society.
Figure 32
Figure 32
Sensing films based on metal nanoparticles with dielectric ligand shells around each nanoparticle. (a) Schematic of a sensing film with Au nanoparticles and alkanethiol ligand shells. (b) Typical example of a fabricated film, TEM image of Au nanoparticles network.
Figure 33
Figure 33
Examples of soft (a–b) and rigid (c–d) linkers utilized to form metal nanoparticle networks: (a) poly(propyleneimine) dendrimer of third generation; (b) polyphenylene dendrimer of first generation; (c) 4-staffane-3,3‴-dithiol; (d) 4,4′-terphenyldithiol. (a) Reprinted with permission from reference. Copyright 2003 Elsevier; (b) Reprinted with permission from reference. Copyright 2007 Wiley; (c–d) Reprinted with permission from reference. Copyright 2007 American Chemical Society.
Figure 34
Figure 34
Response of chemiresistors with short aromatic organothiol linkers of 3 – 6 nm Au nanoparticles upon exposure to diverse vapors. (a) Chemical structures of linkers. (b) Chemiresistor responses to diverse vapors. Reprinted with permission from reference. Copyright 2000 Royal Society of Chemistry.
Figure 35
Figure 35
Responses of several functionalized nanocluster films to toluene and DMMP vapors (both vapors were at P/P0 = 0.1) Reprinted with permission from reference.
Figure 36
Figure 36
Interaction mechanisms of DMMP vapor with different nanocluster films: (a) Au:C5COOH and (b) Au:HFIP. Reprinted with permission from reference.
Figure 37
Figure 37
Responses of chemiresistors based on Au nanoparticle films with PPI G1 – G5 dendrimers to toluene, 1-propanol, and water vapors. Reprinted with permission from reference. Copyright 2003 Elsevier.
Figure 38
Figure 38
Scores plot of a PCA model of response a nine-sensor array with diverse types of monolayer-protected metal nanoparticles to samples of real and simulated breath from lung cancer patients and healthy volunteers. Reprinted with permission from reference. Copyright 2009 Nature Publishing Group.
Figure 39
Figure 39
Effects of humidity on sensor performance with C8SH film. (a) Humidity-dependent resistance-capacitance response. (b) Decrease of sensitivity to analyte vapors in presence of humidity Reprinted with permission from reference. Copyright 2005 Elsevier.
Figure 40
Figure 40
Humidity-independent operation using a single RFID sensor with the multivariable signal transduction and a monolayer capped Au nanoparticles as a sensing film. (a) Experimental design of a test cycle for evaluation of sensor response to different concentrations of individual vapors (water and toluene) and their mixtures; (b) Sensor Fp response; and (c) Sensor Zp response.
Figure 41
Figure 41
Quantitation of an analyte vapor (acetone) in the presence of multiple interferences (water and ethanol vapors) using a single RFID sensor with multi-variable signal transduction and Au:C8SH nanoparticle-based film. (a) Plot of PC1 vs. PC2 illustrates sensor response to four concentrations of acetone vapor (0.044, 0.089, 0.133, and 0.178 P/Po) at two concentrations of water vapor (0.18 and 0.36 P/Po) and two concentrations of ethanol vapor (0.09 and 0.18 P/Po). (b) Multivariate calibration curves for acetone detection in the presence of two interferences (water and ethanol vapors).
Figure 42
Figure 42
Technology readiness levels in development of new gas sensors.

Similar articles

Cited by

References

    1. Farrar JT, Zworykin VK, Baum J. Science. 1957;126:975. - PubMed
    1. Mackay RS, Jaconson B. Nature. 1957;179:1239. - PubMed
    1. Messer H, Zinevich A, Alpert P. Science. 2006;312:713. - PubMed
    1. Receveur RAM, Lindemans FW, De Rooij NF. J. Micromech. Microeng. 2007;17:R50.
    1. Fleming WJ. IEEE Sensors J. 2008;8:1900.

Publication types