. 2011 Nov 4;286(44):38592-38601.
doi: 10.1074/jbc.M111.252171. Epub 2011 Sep 7.

Aging neural progenitor cells have decreased mitochondrial content and lower oxidative metabolism

Affiliations

Aging neural progenitor cells have decreased mitochondrial content and lower oxidative metabolism

Elizabeth A Stoll et al. J Biol Chem. .

Abstract

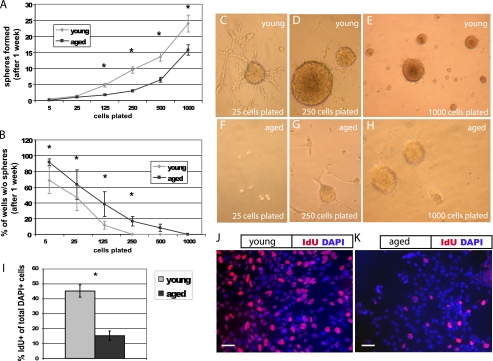
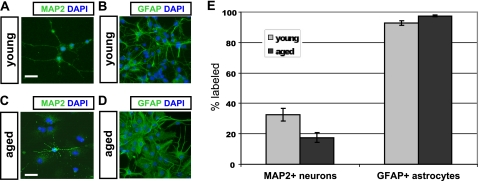
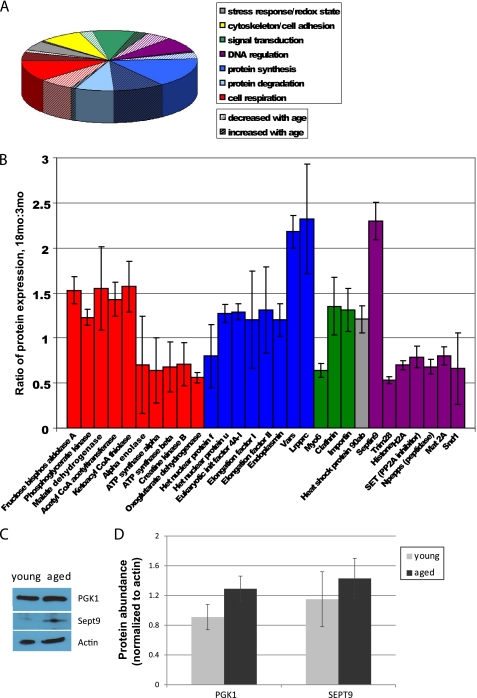
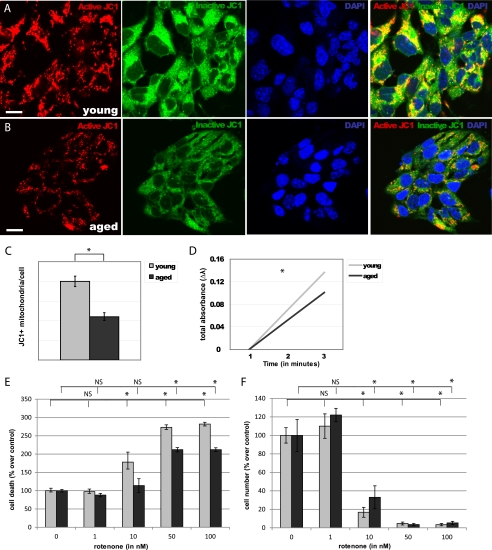
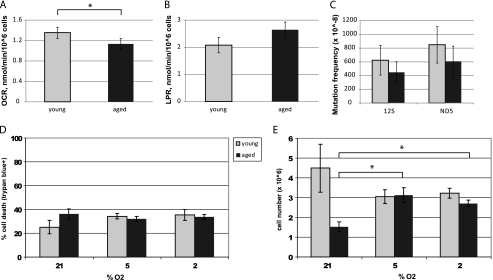
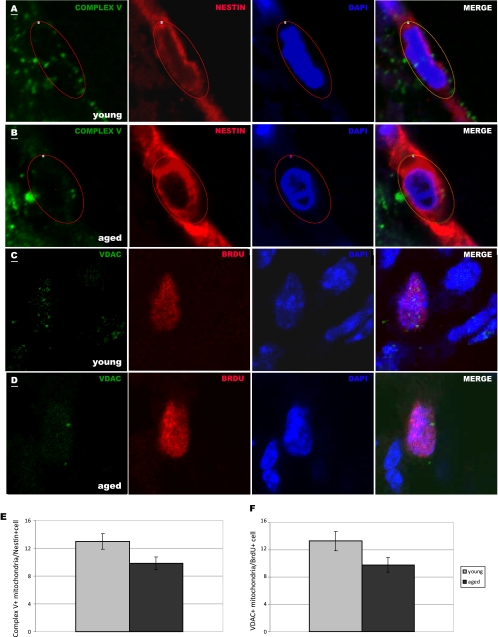
Although neurogenesis occurs in discrete areas of the adult mammalian brain, neural progenitor cells (NPCs) produce fewer new neurons with age. To characterize the molecular changes that occur during aging, we performed a proteomic comparison between primary-cultured NPCs from the young adult and aged mouse forebrain. This analysis yielded changes in proteins necessary for cellular metabolism. Mitochondrial quantity and oxygen consumption rates decrease with aging, although mitochondrial DNA in aged NPCs does not have increased mutation rates. In addition, aged cells are resistant to the mitochondrial inhibitor rotenone and proliferate in response to lowered oxygen conditions. These results demonstrate that aging NPCs display an altered metabolic phenotype, characterized by a coordinated shift in protein expression, subcellular structure, and metabolic physiology.


Figures

FIGURE 1.
FIGURE 1.
Aged NPCs have a lower proliferative index. Cells were plated at serial dilutions in 96-well plates. After 1 week, neurospheres were quantified. A, NPCs derived from the young adult forebrain produced more neurospheres at nearly every plating dilution compared with those from the aged adult forebrain (p < 0.01, linear regression analysis; error bars, S.E.). B, aged cells produced more wells with no spheres at each dilution (B, p < 0.01, linear regression analysis). C–H, cultures from the young adult (C–E) and aged adult brain (F–H) are shown, after 1 week, at original plating dilutions of 25 cells (C and F), 250 cells (D and G), and 1000 cells (E and H). I, aged cells incorporate significantly less of the thymidine analog IdU during a 30-min pulse compared with young cells (p < 0.05). J and K, pictured are young (J) and aged (K) NPCs labeled with the nuclear marker DAPI (blue) and IdU (red). Scale bars, 10 μm.
FIGURE 2.
FIGURE 2.
Neuronal differentiation is impaired in aged NPCs. Young adult NPCs (A and B) and aged adult NPCs (C and D) were subjected to optimized differentiation protocols in vitro. Young adult NPCs (A) differentiated into significantly more MAP2+ neurons than aged adult NPCs (C), when plated under permissive conditions (E, p < 0.05; error bars, S.E.). Young NPCs (B) differentiated into significantly fewer glial fibrillary acidic protein-positive (GFAP+) astrocytes than aged NPCs (D), when plated in serum (E, p < 0.05). Scale bars, 10 μm.
FIGURE 3.
FIGURE 3.
Comparative proteomics assay reveals age-related changes in metabolic protein expression. A, 124 proteins were identified by MS/MS and grouped by pathway. B, identified proteins with significant age-related differences are shown (error bars, S.D.). Few changes were observed in proteins involved in cytoskeletal maintenance, cell-cell adhesion, stress response, redox state, or protein degradation. Significant age-related decreases were observed primarily in signal transduction, transcriptional regulation, and aerobic respiration (ATP synthesis), whereas significant age-related increases in protein expression were observed primarily in signal transduction, protein synthesis, and anaerobic respiration. C, Western blot analyses were performed to measure the abundance of several proteins identified using MS/MS, including phosphoglycerate kinase (PGK1) and septin 9 (Sept9). D, a 41% increase in phosphoglycerate kinase 1 and a 25% increase in septin 9 were observed, although these changes were not statistically significant (p > 0.05; error bars, S.E.).
FIGURE 4.
FIGURE 4.
Aged NPCs have fewer mitochondria and are resistant to rotenone toxicity. A and B, numbers of JC1+ mitochondria (red) were quantified in young adult (A) and aged adult (B) NPCs. Scale bars, 5 μm. C, a significant decrease in JC1+ mitochondria/cell was observed in aged NPCs (p < 0.0001; error bars, S.E.). D, a significant decrease in citrate synthase activity was observed in aged NPCs (p < 0.01). E and F, cell viability (E) and cell number (F) significantly decreased in both young and aged NPCs upon exposure to 50 nm and 100 nm of rotenone; viability of young NPCs also significantly decreased after exposure to 10 nm rotenone (p < 0.01), whereas aged NPCs were unaffected (p > 0.05).
FIGURE 5.
FIGURE 5.
Aged NPCs have decreased aerobic activity and a proliferative response to lowered oxygen conditions. A, oxygen consumption rate (OCR) was significantly lower in aged cells (p < 0.01; error bars, S.E.). B, lactate production rate (LPR) was higher in aged cells, although not significantly so (p = 0.16). C, no significant differences in mutation frequency were observed between young and aged NPCs at either locus tested: 12 S rRNA and ND5 (p > 0.05). D and E, viability (D) and cell number (E) under various oxygen conditions are shown. Aged cells were less viable than young cells (p < 0.05) and had a significantly lower cell count (p < 0.001) under ambient laboratory conditions (21% O2). Young NPCs had no significant changes in viability or cell number under varying oxygen conditions (p > 0.05). Aged NPCs significantly increased cell number under 5% or 2% oxygen conditions (p < 0.01 and p < 0.001, respectively), without any changes in cell viability (p > 0.05).
FIGURE 6.
FIGURE 6.
Aged NPCs contain fewer Complex V+ mitochondria in vivo. A and B, Nestin-labeled NPCs (red) with DAPI-labeled nuclei (blue) within the young adult (A) and aged adult (B) SVZ contain perinuclear Complex V+ mitochondria (green). C and D, BrdU-labeled NPCs (red) with DAPI-labeled nuclei (blue) within the young (C) and aged (D) SVZ contain perinuclear VDAC+ mitochondria (green). Scale bars, 1 μm. A single representative optical plane representing mitochondria is overlapped with a nearby optical plane showing nuclear staining in each photomicrograph. Complex V+ mitochondria were counted within circled regions of interest in the perinuclear region of Nestin+ cells (A and B); VDAC+ mitochondria were counted within the perinuclear region of BrdU+ cells. E and F, aged NPCs contained, on average, 24% fewer Complex V+ mitochondria (E, p < 0.05) and 26% fewer VDAC+ mitochondria (F, p < 0.05) per cell compared with young NPCs.

References

    1. Kuhn H. G., Dickinson-Anson H., Gage F. H. (1996) J. Neurosci. 16, 2027–2033 - PMC - PubMed
    1. Jin K., Sun Y., Xie L., Batteur S., Mao X. O., Smelick C., Logvinova A., Greenberg D. A. (2003) Aging Cell 2, 175–183 - PubMed
    1. Drapeau E., Mayo W., Aurousseau C., Le Moal M., Piazza P. V., Abrous D. N. (2003) Proc. Natl. Acad. Sci. U.S.A. 100, 14385–14390 - PMC - PubMed
    1. Siwak-Tapp C. T., Head E., Muggenburg B. A., Milgram N. W., Cotman C. W. (2007) Neurobiol. Learn. Mem. 88, 249–259 - PMC - PubMed
    1. Molofsky A. V., Slutsky S. G., Joseph N. M., He S., Pardal R., Krishnamurthy J., Sharpless N. E., Morrison S. J. (2006) Nature 443, 448–452 - PMC - PubMed

Publication types