. 2011 Dec;21(12):2190-202.
doi: 10.1101/gr.116764.110. Epub 2011 Sep 7.

A metabolomic and systems biology perspective on the brain of the fragile X syndrome mouse model

Affiliations

A metabolomic and systems biology perspective on the brain of the fragile X syndrome mouse model

Laetitia Davidovic et al. Genome Res. 2011 Dec.

Abstract

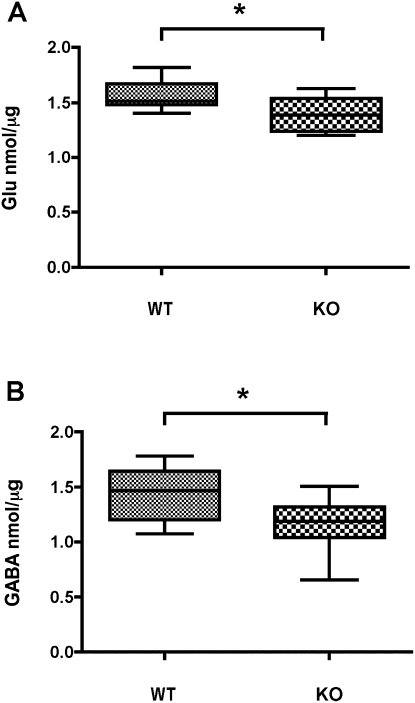
Fragile X syndrome (FXS) is the first cause of inherited intellectual disability, due to the silencing of the X-linked Fragile X Mental Retardation 1 gene encoding the RNA-binding protein FMRP. While extensive studies have focused on the cellular and molecular basis of FXS, neither human Fragile X patients nor the mouse model of FXS--the Fmr1-null mouse--have been profiled systematically at the metabolic and neurochemical level to provide a complementary perspective on the current, yet scattered, knowledge of FXS. Using proton high-resolution magic angle spinning nuclear magnetic resonance ((1)H HR-MAS NMR)-based metabolic profiling, we have identified a metabolic signature and biomarkers associated with FXS in various brain regions of Fmr1-deficient mice. Our study highlights for the first time that Fmr1 gene inactivation has profound, albeit coordinated consequences in brain metabolism leading to alterations in: (1) neurotransmitter levels, (2) osmoregulation, (3) energy metabolism, and (4) oxidative stress response. To functionally connect Fmr1-deficiency to its metabolic biomarkers, we derived a functional interaction network based on the existing knowledge (literature and databases) and show that the FXS metabolic response is initiated by distinct mRNA targets and proteins interacting with FMRP, and then relayed by numerous regulatory proteins. This novel "integrated metabolome and interactome mapping" (iMIM) approach advantageously unifies novel metabolic findings with previously unrelated knowledge and highlights the contribution of novel cellular pathways to the pathophysiology of FXS. These metabolomic and integrative systems biology strategies will contribute to the development of potential drug targets and novel therapeutic interventions, which will eventually benefit FXS patients.


Figures

Figure 1.
Figure 1.
Expression of FMRP in post-natal brain. (A) Western blot analysis of FMRP expression in total brain extracts (25 μg/lane) at various post-natal stages and in adult (Ad.). (B) Immunohistochemistry on 12-d-old mouse brain longitudinal sections reveal a strong expression of FMRP (brown) in the whole brain and in specific regions (C), such as cortex (ctx), hippocampus (hip), striatum (str) and cerebellum (crb). Nuclei were counterstained with cresyl-violet.
Figure 2.
Figure 2.
Metabolic signature of Fmr1-deficiency in 12-d-old brain. The metabolic variation observed in 1H NMR spectra acquired in 12-d-old mouse brain samples was modeled using an orthogonal partial least square-discrimination analysis (OPLS-DA). PLS components maximizing the segregation of the groups are computed. Each PLS component corresponds to a combination of the initial 1H NMR spectral variables, known as model coefficients or loadings. Each individual spectrum has new coordinates on the PLS components, known as scores. As a consequence, the three-dimensional OPLS-DA scores plot (A) segregates the different sample groups according to brain region (shapes) and Fmr1-deficiency status (white and black shapes). (B) OPLS variance component model of cortex and cerebellum. (Ctx) cortex, (crb) cerebellum, (hip) hippocampus, (str) striatum, (ko) Fmr1-knockout, (wt) wild-type samples.
Figure 3.
Figure 3.
Region-specific metabolic signature of Fmr1-deficiency in 12-d-old brain. Metabolic variations in 1H NMR spectra obtained from Fmr1-null and wild-type mice were assessed independently for each brain region by OPLS-DA. These OPLS-DA models are represented as a pseudo-spectrum. Positive model coefficients correspond to higher metabolite concentrations in KO animals, whereas negative model coefficients are associated with higher metabolite concentrations in WT animals. Metabolic signature as obtained from cortex (Q2Yhat = 0.61) (A), cerebellum (Q2Yhat = 0.57) (B), hippocampus (Q2Yhat = 0.84) (C), and striatum (Q2Yhat = 0.44) (D).
Figure 4.
Figure 4.
Quantification of glutamate levels in cortical extracts and GABA levels in cerebellar extracts of Fmr1-KO brain vs. WT. Glutamate cortical (A) and GABA cerebellar concentrations (B) are significantly reduced in Fmr1-KO extracts compared to WT (P = 0.011; P = 0.038, respectively; n = 9 for each genotype).
Figure 5.
Figure 5.
Interactome-mapping of FMR1-deficiency metabotype. (A) FMR1 integrated metabolome and interactome mapping (iMIM) network. The metabolites significantly affected in the different models (Table 1) were mapped onto the interactome, using FMRP mRNA targets and protein interactors, KEGG metabolic pathways, and neurotransmitter/receptor databases. The resulting network allows connecting of the causal gene FMR1 to the downstream metabolic consequences of its deficiency. Pivotal shortest paths via enzymes and receptors are represented in blue and green, respectively. (B) Statistical validation of the FMR1 knowledge network under the null hypothesis (H0). The average shortest path length (spl) between FMR1 and the biomarker metabolites (n = 25) was computed and compared to the distribution of average spl obtained after 100,000 H0 network simulations (i.e., networks obtained after 100,000 random selections of 25 metabolites from the entire metabolic network). This simulation under the null hypothesis shows that FMR1 appears significantly connected to the candidate biomarker metabolites, with an average distance of 3.38 hops (n = 100,000 random simulations, P = 0.03427).
Figure 6.
Figure 6.
Fmr1, Mtap1b, Sod1, Rhoa, and Calb1 mRNAs interact with FMRP in vivo. (A) Western blot analysis of UV-crosslinking and immunoprecipitation (CLIP) assay performed on Fmr1 wild-type (WT) and knock-out (KO) total brain lysates using polyclonal antibodies raised against the C terminus of FMRP. Input lysate (1/100th) and immunoprecipitates (IP, 1/20th) were probed for FMRP and its interacting protein partners FXR1P and FXR2P, respectively, by western blotting, revealing the presence of FMRP in the WT immunoprecipitates (upper panel revealed with 1C3 antibody), together with interacting partners FXR1P and FXR2P (lower panel revealed by 3Fx antibody). (B) RT-PCR analysis of mRNAs associated with FMRP. Total RNA was extracted from the input brain lysate and immunoprecipitates described in A, and used as a template for RT-PCR. RT-PCR products obtained from Fmr1-KO (lane 1) and WT (lane 2) inputs and from immunoprecipitates of Fmr1-KO (lane 3) and WT (lane 4) brain extracts were separated and visualized by agarose gel electrophoresis. This reveals that the known FMRP mRNA targets Fmr1 and Mtap1B are selectively recovered in the WT immunoprecipitate, while the unrelated mRNA Tubb3 is not recovered. Sod1 mRNA is also selectively recovered in the immunoprecipitate together with Rhoa and Calb1 mRNAs. Control PCR (lane 5) was performed in the absence of reverse-transcriptase. Lower DNA molecular weight markers presented on the left of the gels are, respectively, 100, 200, 300, 400, 500, 600, 800, and 1000 bp.
Figure 7.
Figure 7.
Schematic metabolic map of Fmr1-deficiency in cortex and cerebellum. Astrocytes and neurons cooperate metabolically for neuronal energy fueling and biosynthesis of neurotransmitters, and this cooperation seems compromised in the Fmr1-null brain. Glucose, lactate, and acetoacetate are neuronal energy substrates (framed in pink) which contribute to replenish acetyl-coA stores to fuel the tricarboxylic acid cycle. Glutamate and GABA can enter the TCA cycle via conversion upstream of or downstream from the intermediate metabolite alpha-ketoglutarate (αKG). Metabolites affected by Fmr1-deficiency are represented in blue if decreased and red if increased. Metabolites acting as neurotransmitters are represented in yellow frames. (NAA) N-acetyl-aspartate, (NAAG) N-acetyl-aspartyl-glutamate, (GAD65) glutamate dehydrogenase, (CHAT) choline O-acetyltransferase, (ACHE) acetylcholinesterase.

References

    1. Akerman CJ, Cline HT 2007. Refining the roles of GABAergic signaling during neural circuit formation. Trends Neurosci 30: 382–389 - PubMed
    1. Bardoni B, Davidovic L, Bensaid M, Khandjian EW 2006. The Fragile X syndrome: Exploring its molecular basis and seeking a treatment. Expert Rev Mol Med 8: 1–16 - PubMed
    1. Bassell GJ, Warren ST 2008. Fragile X syndrome: Loss of local mRNA regulation alters synaptic development and function. Neuron 60: 201–214 - PMC - PubMed
    1. Bechara EG, Didiot MC, Melko M, Davidovic L, Bensaid M, Martin P, Castets M, Pognonec P, Khandjian EW, Moine H, et al. 2009. A novel function for Fragile X mental retardation protein in translational activation. PLoS Biol 7: e16 doi: 10.1371/journal.pbio.1000016 - PMC - PubMed
    1. Ben-Ari Y, Gaiarsa JL, Tyzio R, Khazipov R 2007. GABA: A pioneer transmitter that excites immature neurons and generates primitive oscillations. Physiol Rev 87: 1215–1284 - PubMed

Publication types