. 2011 Nov;22(21):3995-4003.
doi: 10.1091/mbc.E11-03-0278. Epub 2011 Sep 7.

The SCAR/WAVE complex is necessary for proper regulation of traction stresses during amoeboid motility

Affiliations

The SCAR/WAVE complex is necessary for proper regulation of traction stresses during amoeboid motility

Effie Bastounis et al. Mol Biol Cell. 2011 Nov.

Abstract

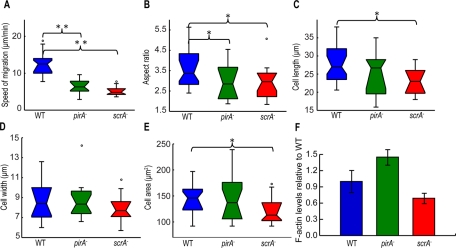
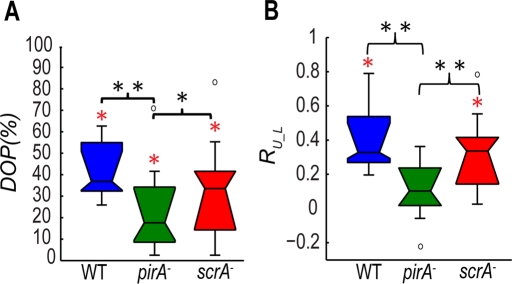
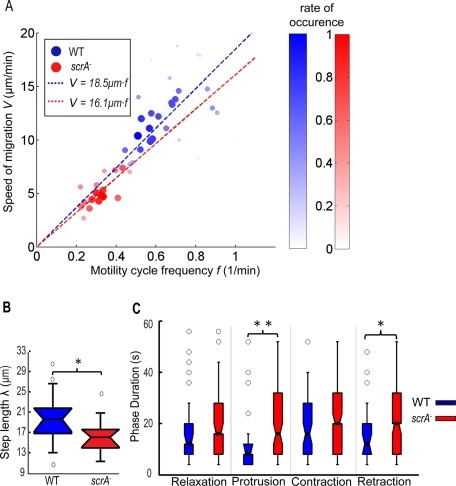
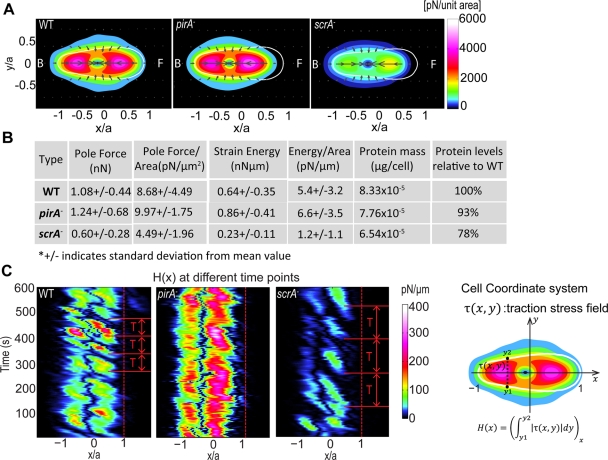
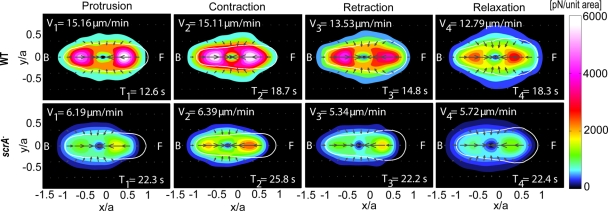
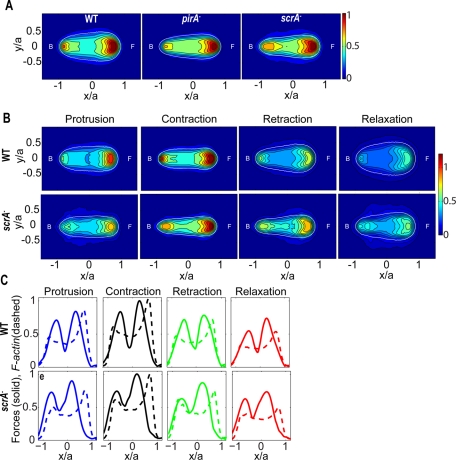
Cell migration requires a tightly regulated, spatiotemporal coordination of underlying biochemical pathways. Crucial to cell migration is SCAR/WAVE-mediated dendritic F-actin polymerization at the cell's leading edge. Our goal is to understand the role the SCAR/WAVE complex plays in the mechanics of amoeboid migration. To this aim, we measured and compared the traction stresses exerted by Dictyostelium cells lacking the SCAR/WAVE complex proteins PIR121 (pirA(-)) and SCAR (scrA(-)) with those of wild-type cells while they were migrating on flat, elastic substrates. We found that, compared to wild type, both mutant strains exert traction stresses of different strengths that correlate with their F-actin levels. In agreement with previous studies, we found that wild-type cells migrate by repeating a motility cycle in which the cell length and strain energy exerted by the cells on their substrate vary periodically. Our analysis also revealed that scrA(-) cells display an altered motility cycle with a longer period and a lower migration velocity, whereas pirA(-) cells migrate in a random manner without implementing a periodic cycle. We present detailed characterization of the traction-stress phenotypes of the various cell lines, providing new insights into the role of F-actin polymerization in regulating cell-substratum interactions and stresses required for motility.


Figures

FIGURE 1:
FIGURE 1:
Boxplots of kinematic parameters of chemotaxing wild-type (blue), pirA (green), and scrA (red) cells. (A) Speed of migration (μm/min). (B) Aspect ratio (cell length divided by cell width). (C) Cell length (μm). (D) Cell width (μm). (E) Area (μm2). Open circles represent outliers, and the notched section of the boxplots shows the 95% confidence interval around the median. Asterisks denote significant differences between distributions: *, 0.01 < pd < 0.05; **, pd < 0.01 (Wilcoxon rank sum test for equal medians). (F) Levels of F-actin of unstimulated cells normalized by the corresponding levels of unstimulated wild-type cells (F-actin assay). Error bars, SD from the average.
FIGURE 2:
FIGURE 2:
(A) Boxplots of the DOP of the time evolution of the cell length L(t). Boxplots refer to wild-type (N = 29, blue), pirA (N = 18, green), and scrA (N = 17, red) cells. (B) Boxplots of the correlation coefficients, RL_U, between the time evolution of the strain energy, Us(t), and the cell length, L(t), for each cell line. Boxplots refer to wild-type (N = 18, blue), pirA (N = 16, green), and scrA (N = 16, red) cells. Black asterisks, significant differences between distributions: *, 0.01 < pd < 0.05, **, pd < 0.01; red asterisks, a distribution with a median significantly different from zero: *, pz < 0.05 (Wilcoxon signed rank test).
FIGURE 3:
FIGURE 3:
(A) Scatter plot of the average speed of migration V versus the frequency f of their motility cycle determined through the time evolution of cell length, L(t) (N = 46). The data points refer to N = 29 wild-type (blue circles) and N = 17 scrA cells (red circles). The dashed blue and red lines are the least square fits to the data for wild-type and scrA cells, respectively. V = 18.5f for wild-type and V = 16.1f for scrA cells, showing that the scrA cells perform a motility cycle with an average step length of 16.1 μm vs. the 18.5 μm in the wild-type cells. The root mean square errors (RMSEs) when fitting the data linearly were RMSEWT = 3.20 and RMSEscrA = 0.99. The correlation coefficients of the two variables were RWT = 0.364 and RscrA = 0.785. To better visualize the correlation, the f–V plane was divided into rectangular tiles of equal area, and the size and color of each data point were scaled according to the total number of data points that fall on each specific tile (i.e., its rate of occurrence). As a result, darker, larger circles represent those data points that were observed more often in our experiments, and vice versa. (B) Boxplots of the average step length λ advanced per period and (C) time duration of each of the four phases for wild-type (blue) and scrA cells (red). Asterisks, significant differences between distributions: *, 0.01< pd < 0.05; **, pd < 0.01.
FIGURE 4:
FIGURE 4:
(A) Average stress distribution pattern for wild-type (N = 14), pirA (N = 17), and scrA (N = 14) cells during chemotaxis on elastic polyacrylamide substrate. The contour maps show the average traction stress field, computed in a reference frame rotated to have the x- and y-axes coincide with the instantaneous principal axes of the cells. All dimensions are scaled with the length of their instantaneous major axis, a. Details of how the cell-coordinate system used in these plots is constructed can be found elsewhere (del Álamo et al., 2007; Alonso-Latorre et al., 2009). The colors indicate the magnitude of the stresses in pN/unit area, and the arrows indicate their direction. The white contours show the average shape of the cells in this reference frame. The front (F) of the cell corresponds to x > 0 and the back (B) to x < 0. (B) First five columns: cell type; average values of the pole forces obtained from the integration of the stresses in the front and the back halves of the cells (Fp); average magnitude of the pole forces normalized by the cell area (Fp/Ac); average strain energy (Us); average strain energy normalized by the cell area (Us/Ac). The last two columns show the average protein amount in μg/cell (DC assay) for each cell line and the average protein amounts in the mutants compared with that measured in wild-type cells. (C) Time evolution of the magnitude of the integral of the traction stresses along the width of the cell as a function of the position along the cell length for a representative wild-type, pirA, and scrA cell (sketch). Dashed lines indicate the cell front. The adhesion sites of the cell can be clearly seen, as well as the frequency of the formation of frontal adhesions, which coincides with the measured period of the motility cycle (T).
FIGURE 5:
FIGURE 5:
Phase-averaged traction stress maps and cell shapes corresponding to the four phases of the motility cycle for wild-type (N = 14) and scrA (N = 14) cells (for description of the contour maps see Figure 4A). The legends show the average durations, T1,…, T4, and the corresponding average speeds during each phase, V1,…, V4.
FIGURE 6:
FIGURE 6:
(A) Average cell shape and localization of Lifeact, a reporter for F-actin, for wild-type (N = 9), pirA (N = 8), and scrA (N = 9) cells. The contour maps show the average fluorescence, computed in the same cell-based normalized reference frame as used in Figure 4A. The colors indicate the intensity of Lifeact. The white contours show the average shape of the cells. The front (F) of the cell corresponds to x > 0 and the back (B) corresponds to x < 0. (B) Phase-averaged cell shape and localization of Lifeact during the four stereotypical phases of the motility cycle for wild-type (N = 9) and scrA (N = 9) cells. (C) Phase-averaged values of the Lifeact fluorescence intensity (dashed line) and of the traction stresses (solid line) integrated along the width of the cell as a function of the position along the cell length for wild-type (N = 6) and scrA (N = 4) cells. The intensity and force levels are normalized with their maximum value for each cell.

References

    1. Abercrombie M, Heaysman J, Pegrum S. The locomotion of fibroblasts in culture. I. Movements of the leading edge. Exp Cell Res. 1970;59:393–398. - PubMed
    1. Alonso-Latorre B, Meili R, Bastounis E, Del Alamo JC, Firtel RA, Lasheras JC. Distribution of traction forces and intracellular markers associated with shape changes during amoeboid cell migration; 31st Annual International Conference of the IEEE Engineering in Medicine and Biology Society, Minneapolis, MN; 2009. pp. 3346–3349. - PMC - PubMed
    1. Ausprunk DH, Folkman J. Migration and proliferation of endothelial cells in preformed and newly formed blood-vessels during tumor angiogenesis. Microvasc Res. 1977;14:53–65. - PubMed
    1. Barnhart EL, Allen GM, Jülicher F, Theriot JA. Bipedal locomotion in crawling cells. Biophys J. 2010;98:933–942. - PMC - PubMed
    1. Basu D, El-Assal SED, Le J, Mallery EL, Szymanski DB. Interchangeable functions of Arabidopsis PIROGI and the human WAVE complex subunit SRA1 during leaf epidermal development. Development. 2004;131:4345–4355. - PubMed

Publication types

LinkOut - more resources