. 2011 Nov;22(21):4068-78.
doi: 10.1091/mbc.E10-08-0703. Epub 2011 Sep 7.

Novel function of keratins 5 and 14 in proliferation and differentiation of stratified epithelial cells

Affiliations

Novel function of keratins 5 and 14 in proliferation and differentiation of stratified epithelial cells

Hunain Alam et al. Mol Biol Cell. 2011 Nov.

Abstract

Keratins are cytoplasmic intermediate filament proteins preferentially expressed by epithelial tissues in a site-specific and differentiation-dependent manner. The complex network of keratin filaments in stratified epithelia is tightly regulated during squamous cell differentiation. Keratin 14 (K14) is expressed in mitotically active basal layer cells, along with its partner keratin 5 (K5), and their expression is down-regulated as cells differentiate. Apart from the cytoprotective functions of K14, very little is known about K14 regulatory functions, since the K14 knockout mice show postnatal lethality. In this study, K14 expression was inhibited using RNA interference in cell lines derived from stratified epithelia to study the K14 functions in epithelial homeostasis. The K14 knockdown clones demonstrated substantial decreases in the levels of the K14 partner K5. These cells showed reduction in cell proliferation and delay in cell cycle progression, along with decreased phosphorylated Akt levels. K14 knockdown cells also exhibited enhanced levels of activated Notch1, involucrin, and K1. In addition, K14 knockdown AW13516 cells showed significant reduction in tumorigenicity. Our results suggest that K5 and K14 may have a role in maintenance of cell proliferation potential in the basal layer of stratified epithelia, modulating phosphatidylinositol 3-kinase/Akt-mediated cell proliferation and/or Notch1-dependent cell differentiation.


Figures

FIGURE 1:
FIGURE 1:
Generation of K14 knockdown clones of HaCaT and AW13516 cells. (A) Western blot analysis of stable K14 knockdown clones (shRK14-D1, -D2, and -D6 derived from HaCaT; shRK14-K7, -K9, and -K16 derived from AW13516) and vector control (pTU6-HaC and pTU6-AW1 derived from HaCaT and AW13516, respectively) cells with antibodies to K14 and K5. β-Actin was used as a loading control. (B) RT-PCR analysis of K14 in stable K14 knockdown and the respective vector control clones. GAPDH was used as internal control. (C and D) Confocal analysis of K14 and K5 levels and filament networks in the indicated clones. Scale bars: 10μm. The mean fluorescence intensity (+SD) of K5 and K14 was calculated per cell by measuring fluorescence intensity of 20 cells of each experiment (using LSM10 software; Carl Zeiss MicroImaging GmbH, Jena, Germany) and is shown in the graph on the right-hand side.***, p < 0.001 for K14; ***, p < 0.001 for K5.
FIGURE 2:
FIGURE 2:
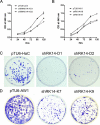
Effect of K14 knockdown on cell growth. (A and B) Cell proliferation curves of K14 knockdown and vector control cells using MTT assay. Cell proliferation was plotted against time. Results are mean ± SD of three independent experiments performed in triplicate. Note decreased cell proliferation in K14 knockdown clones. (C and D) Colony-forming assay in K14 knockdown cells. Representative images of colonies stained with crystal violet formed by the indicated clones after 14 d.
FIGURE 3:
FIGURE 3:
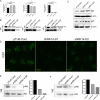
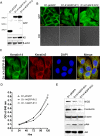
K14 knockdown resulted in delayed cell cycle progression. (A) Histograms (mean ± SD for three independent experiments) showing percentage of cells in cell cycle phases (G0/G1, S, and G2/M phase) in stable K14 knockdown and vector control clones after indicated time points, as analyzed by flow cytometry. ***, p < 0.0001 for G0/G1 phase; *, p < 0.001 for S phase; ***, p < 0.0001 for G2/M phase. (B and C) Western blot analysis of stable K14 knockdown clones (shRK14-D1 and shRK14-D2) and vector controls (pTU6-HaC) with antibodies to cyclin-D1, PCNA, phosphorylated histone-H3, p21, and p27. β-Actin was used as a loading control. (D) Staining of cell proliferation marker Ki67: confocal analysis of Ki67 in K14 knockdown (shRK14-D1 and shRK14-D2) and vector control (pTU6-HaC) clones. Scale bars: 10 μm. (E and F) Western blot analysis of stable K14 knockdown clones and vector control clones (shRK14-D1 and shRK14-D2 derived from HaCaT and shRK14-K7 and shRK14-K9 derived from AW13516) and the respective vector controls (pTU6-HaC and pTU6-AW1) with antibodies to phosphorylated form of Akt. Total Akt was used to validate equal loading.
FIGURE 4:
FIGURE 4:
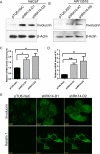
Alterations in cell differentiation–associated molecules. (A and B) Western blot analysis of stable K14 knockdown clones (shRK14-D1 and -D2; shRK14-K7 and -K9) and the respective vector control clones (pTU6-HaC and pTU6-AW1) with antibodies to involucrin. β-Actin was used as a loading control. (C) Confocal analysis of involucrin and K1 levels in the indicated clones. Scale bars: 10 μm. (D and E) mRNA levels of involucrin and K1 in indicated clones were determined by real-time PCR analysis. Levels of mRNA were normalized by GAPDH. The graph shows mean ± SD for three independent experiments done in triplicate. *, p < 0.05; **. p < 0.01.
FIGURE 5:
FIGURE 5:
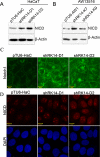
Activation of Notch1 signaling upon K14 knockdown. (A and B) Western blot analysis of stable K14 knockdown and the respective vector control clones with antibodies to NICD. β-Actin was used as a loading control. Confocal analysis of cell surface (C) and NICD (D) in the indicated clones. Scale bars: 10 μm.
FIGURE 6:
FIGURE 6:
Tumorigenicity assays for K14 knockdown clones. (A) Representative images of nude mice bearing tumor of indicated clones 8 wk after the injection. (B) Tumor growth was plotted against time. Results are mean ± SD for five animals injected for each clone. Note decreased tumorigenicity in K14 knockdown clones (*, p < 0.05). (C) Haematoxylin and eosin along with immunohistochemical staining (with antibody against K14) of paraffin-embedded sections of tumor tissues obtained from nude mice injected with indicated clones.
FIGURE 7:
FIGURE 7:
Rescue of molecular and phenotypic changes of K14 knockdown cells. (A and E) Western blot analysis of stable K14GFP-R clones (D1-K14GFP-R11 and -R12) and pEGFP clone (D1-pEGFP) derived from K14 knockdown clone shRK14-D1 cells with antibodies to GFP, K5, involucrin, Notch1, and phosphorylated form of Akt. Total Akt was used as loading control for the phosphorylated form of Akt while β-actin was used as loading control for the rest of the antibodies. (B) Confocal analysis of EGFP-tagged K14 and EGFP of the indicated clones. (C) Analysis of filament formation of EGFP-tagged K14 with K5 in the indicated clone using confocal microscopy. (D) Cell proliferation curve of D1-K14GFP-R11, -R12 and D1-pEGFP determined by MTT assay. The graph shows mean ± SD of three independent experiments performed in triplicate.

References

    1. Alam H, Kundu ST, Dalal SN, Vaidya MM. Loss of keratins 8 and 18 leads to alterations in alpha6beta4-integrin-mediated signalling and decreased neoplastic progression in an oral-tumour-derived cell line. J Cell Sci. 2011;124:2096–2115. - PubMed
    1. Albers KM. Keratin biochemistry. Clin Dermatol. 1996;14:309–320. - PubMed
    1. Alessi DR, James SR, Downes CP, Holmes AB, Gaffney PR, Reese CB, Cohen P. Characterization of a 3-phosphoinositide-dependent protein kinase which phosphorylates and activates protein kinase Bα. Curr Biol. 1997;7:261–269. - PubMed
    1. Allenspach EJ, Maillard I, Aster JC, Pear WS. Notch signaling in cancer. Cancer Biol Therapy. 2002;1:466–476. - PubMed
    1. Bray SJ. Notch signalling: a simple pathway becomes complex. Nat Rev. 2006;7:678–689. - PubMed

Publication types

MeSH terms