. 2011 Dec;106(6):2964-72.
doi: 10.1152/jn.00157.2011. Epub 2011 Sep 7.

Endogenous modulation of low frequency oscillations by temporal expectations

Affiliations

Endogenous modulation of low frequency oscillations by temporal expectations

Andre M Cravo et al. J Neurophysiol. 2011 Dec.

Abstract

Recent studies have associated increasing temporal expectations with synchronization of higher frequency oscillations and suppression of lower frequencies. In this experiment, we explore a proposal that low-frequency oscillations provide a mechanism for regulating temporal expectations. We used a speeded Go/No-go task and manipulated temporal expectations by changing the probability of target presentation after certain intervals. Across two conditions, the temporal conditional probability of target events differed substantially at the first of three possible intervals. We found that reactions times differed significantly at this first interval across conditions, decreasing with higher temporal expectations. Interestingly, the power of theta activity (4-8 Hz), distributed over central midline sites, also differed significantly across conditions at this first interval. Furthermore, we found a transient coupling between theta phase and beta power after the first interval in the condition with high temporal expectation for targets at this time point. Our results suggest that the adjustments in theta power and the phase-power coupling between theta and beta contribute to a central mechanism for controlling neural excitability according to temporal expectations.


Figures

Fig. 1.
Fig. 1.
Experimental paradigm. A: participants viewed a warning signal (WS) followed by a Go/No-go target at either 1.25, 2.25, or 3.25 s after the WS onset. B: target probability and anticipation functions for both experimental conditions. Bar plots represent the physical probability of target presentation after the 3 possible foreperiods (FPs). Line plots represent the anticipation functions (Janssen and Shadlen 2005) for each probability distribution. C: reaction times (means ± SE) for each FP and probability distribution. There was a significant difference between distributions only in the first FP. D: grand-averaged waveforms elicited by targets presented after the longest FP (3.25 s). Results showed significant difference between the contingent negative variation between probability distributions in the period around the first FP. RT, reaction time.
Fig. 2.
Fig. 2.
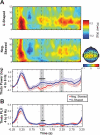
A: time-frequency representation of the theta-band power at electrode Cz. Bottom: averaged activity over 4 Hz to 8 Hz. Time window of interest was defined at −100 to 100 ms around the 2 first FPs (grey patches at bottom). Thick grey lines represent temporal clusters where there was a significant difference between conditions. There was significant difference between conditions only in the first time window. Scalp distribution shows theta power averaged across both conditions and FPs. B: averaged phase-locking values (PLV) activity over 4 to 8 Hz at electrode Cz. PLV is an index of how concentrated the data sample is around the mean direction. Higher values indicate more synchronization across trials. Time window of interest was defined at −100 to 100 ms around the at first FPs (grey patches at bottom). Thick grey lines represent temporal clusters where there was a significant difference between conditions.
Fig. 3.
Fig. 3.
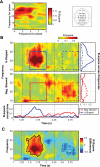
A: phase-power coupling between theta phase and beta power. Representation of the circular-linear coefficient (r-square) between theta-phase angle (4–8 Hz) at electrode Cz and higher frequencies power (10 to 30 Hz) at electrode C3. The r-squares were calculated for the time period between 1 to 3 s after WS and collapsed over experimental conditions. B: representation of the circular-linear coefficient (r-square) between theta-phase angle (5 Hz) at electrode Cz and beta power (14 Hz to 30 Hz) at electrode C3. The r-squares were calculated for overlapping time windows of 600 ms from 1 to 3 s after WS presentation. Bottom: r-square across time averaged over 15 to 25 Hz. Right: r-square across frequencies averaged for the period from 1.5 to 2 s (continuous line) and 2.5 to 3 s (dashed line). C: difference of the r-square between conditions (U-Shaped − Neg. Skewed). Contours indicate the 2 clusters where the r-square were different between conditions. First cluster reached significance (P < 0.01), while the second was not statistically significant (P > 0.3).
Fig. 4.
Fig. 4.
Distribution of beta power over the phases of theta. Representation of the relationship between theta-phase angle and beta power (15 to 25 Hz) on both experimental conditions over the period from 1.5 to 2 s (continuous squares on Fig. 4). Colormaps shows how the power of beta was distributed over the phase angles of theta. Bottom: averaged z-score over beta power (15 to 25 Hz) for theta-phase angle.

References

    1. AEEGS American Electroencephalographic Society guidelines for standard electrode position nomenclature. J Clin Neurophysiol 8: 200–202, 1991 - PubMed
    1. Alegre M, Imirizaldu L, Valencia M, Iriarte J, Arcocha J, Artieda J. Alpha and beta changes in cortical oscillatory activity in a go/no go randomly-delayed-response choice reaction time paradigm. Clin Neurophysiol 117: 16–25, 2006 - PubMed
    1. Berens P. CircStat: A MATLAB toolbox for circular statistics. J Stat Software 31: 1–21, 2009
    1. Bueti D, Bahrami B, Walsh V, Rees G. Encoding of temporal probabilities in the human brain. J Neurosci 30: 4343–4352, 2010 - PMC - PubMed
    1. Busch NA, VanRullen R. Spontaneous EEG oscillations reveal periodic sampling of visual attention. Proc Natl Acad Sci USA 107: 16048–16053, 2010 - PMC - PubMed

Publication types

LinkOut - more resources