. 2011 Dec;106(6):2992-3000.
doi: 10.1152/jn.01134.2010. Epub 2011 Sep 7.

Flexible interpretation of a decision rule by supplementary eye field neurons

Affiliations

Flexible interpretation of a decision rule by supplementary eye field neurons

S J Heinen et al. J Neurophysiol. 2011 Dec.

Abstract

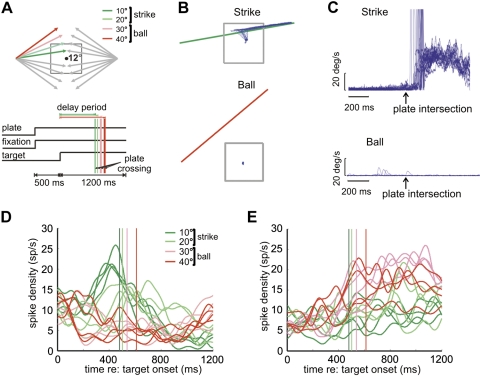
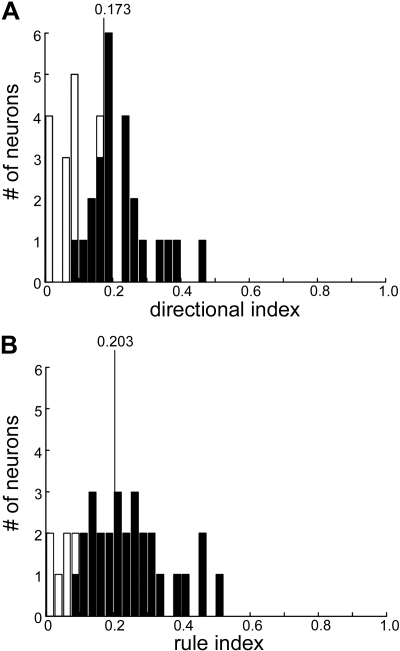
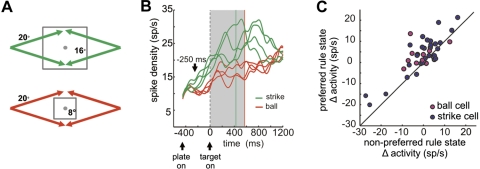
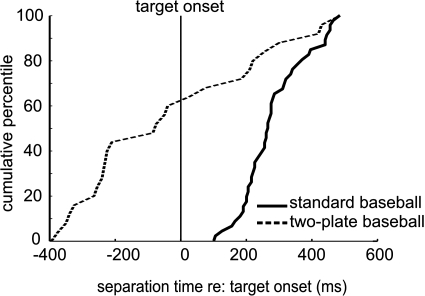
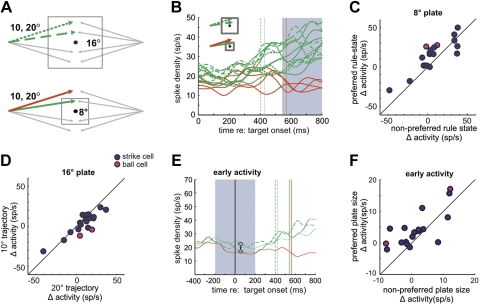
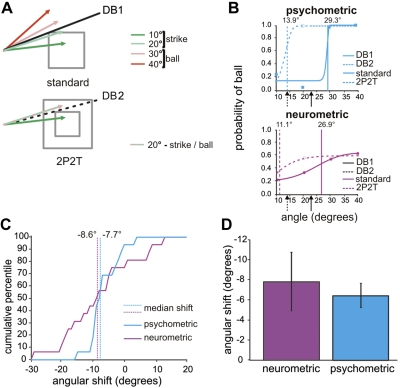
Since the environment is in constant flux, decision-making capabilities of the brain must be rapid and flexible. Yet in sensory motion processing pathways of the primate brain where decision making has been extensively studied, the flexibility of neurons is limited by inherent selectivity to motion direction and speed. The supplementary eye field (SEF), an area involved in decision making on moving stimuli, is not strictly a sensory or motor structure, and hence may not suffer such limitations. Here we test whether neurons in the SEF can flexibly interpret the rule of a go/nogo task when the decision boundary in the task changes with each trial. The task rule specified that the animal pursue a moving target with its eyes if and when the target entered a visible zone. The size of the zone was changed from trial to trial in order to shift the decision boundary, and thereby assign different go/nogo significance to the same motion trajectories. Individual SEF neurons interpreted the rule appropriately, signaling go or nogo in compliance with the rule and not the direction of motion. The results provide the first evidence that individual neurons in frontal cortex can flexibly interpret a rule that governs the decision to act.


Figures

Fig. 1.
Fig. 1.
Standard ocular baseball. A: task schematics. Top: spatial layout, showing 16 possible target trajectories in relation to the visible 12° plate on the screen. The dot at the center is the fixation spot. Trajectory angles are 10°, 20°, 30°, and 40° with respect to the horizontal meridian. Four trajectories are color coded to illustrate strike (green) and ball (red) trajectories. In each trial, a target appeared at 20° left or right in the periphery and moved inward at 30°/s. Bottom: the temporal events for each trial. The vertical lines show plate intersection times for trials with different angles of horizontal deviation. B: Cartesian eye position from a single block of strike and ball trials. C: radial eye velocity for the same block of trials. D: mean spike rate for a strike neuron in strike (green) and ball (red) trials. The vertical lines indicate corresponding plate intersection times. E: mean spike rate for a ball neuron.
Fig. 2.
Fig. 2.
Directional and rule tuning during the delay period of standard ocular baseball. A: directional index (DI) values for recorded supplementary eye field (SEF) neurons, with filled bars indicating significant directional tuning. The vertical line indicates the mean of DI distribution. B: rule index (RI) values for the same group of SEF neurons.
Fig. 3.
Fig. 3.
Results of the 2-plate task with a constant trajectory angle (2P1T). A: spatial schematic. Plate size was randomly chosen as either 16° (top) or 8° (bottom), and the target trajectory was always 20°, which resulted in either strike (green) or ball (red) trials, respectively. B: typical neuronal activity recorded in 2P1T trials. Activity is shown as average spike density for all 8 combinations of plate size and trajectory direction in 1 block. Green and red traces are activity for the large (strike) and small (ball) plates, respectively. Green and red vertical lines indicate plate intersection times for strike and ball trials, respectively. Note greater activity for the large plate when all targets specified strike (green curves). The gray shaded region indicates the analysis period (0–570 ms after target motion onset). C: population summary for strike and ball neurons. Each point represents neuronal activity for preferred vs. nonpreferred rule states, where the preferred rule state is strike (large plate) for strike neurons and ball (small plate) for ball neurons.
Fig. 4.
Fig. 4.
Cumulative percentile of separation times in standard and 2-plate (2P1T) baseball. Separation time is defined as the time at which the activity of a neuron first became statistically different between strike and ball trials (see methods). The solid vertical line indicates when the target began to move.
Fig. 5.
Fig. 5.
Results of 2-plate, 2-trajectory (2P2T) task. A: spatial schematic. Plate size was either 16° (top) or 8° (bottom), and target trajectories were 10° or 20°, all randomized within a block. B: activity of a typical neuron in the 2P2T experiment. Average activity for each trajectory is shown for the large plate (dashed green traces, 10° trajectory; dotted, 20°) and for the small plate (solid green traces, 10°; solid red, 20°). Gray shaded region indicates the analysis period (550–800 ms). The cells were initially classified as baseball related based on delay period activity in standard baseball. A late analysis period is used here because many cells signaled plate size before the target appeared, possibly contaminating the earlier part of delay period. C: summary data for the small plate. Each point represents activity for a single neuron in 2P2T for the trajectories that conformed to its preferred and nonpreferred rule states as determined by their activity in standard ocular baseball. Note higher activity for most cells when the trajectory conformed to the preferred rule state, indicating that neurons were discriminating the different rule states. D: summary data for the large plate. Here the x-axis shows normalized activity for the 10° trajectory and the y-axis for the 20° trajectory. Note that overall there was no significant difference in activity for the 2 trajectories, indicating that neurons classified them as conforming to the same rule state. E: activity of a strike cell averaged over combinations of same angle and plate size from a block of trials showing putative probabilistic encoding of the rule. Green traces are strike trials with the small plate (solid) and large plate, 10° (dashed) and 20° (dotted). The red trace represents the small-plate ball trials. Vertical lines represent plate intersection and are color coded correspondingly. Note that this neuron first responds more for the large plate (top circled traces) than the small plate (bottom circled traces) but later in the trial signals strike and ball. Shaded region shows the analysis period (±200 ms relative to target onset). F: summary data of early activity for all recorded SEF neurons. Activity for the preferred plate size is plotted against that observed for the nonpreferred plate size for both strike and ball neurons. Note that most cells signaled plate size. The difference in activity, Δ activity, for the preferred plate size refers to the spike rate for large-plate trials minus that for small-plate trials for strike neurons and the small-plate spike rate minus the large-plate spike rate for ball neurons.
Fig. 6.
Fig. 6.
Comparing choices of neuron and monkey in ocular baseball relative to a decision boundary change. A: decision boundaries in standard ocular baseball (top) and the 2P2T experiment (bottom). Green and red arrows indicate strike and ball trajectories (alternating red/green trajectory is either a strike or ball trajectory depending on plate size), and black solid and dashed lines show objective decision boundaries for the 12° plate in standard ocular baseball (DB1) and for the 8° plate in 2P2T baseball with the small plate size (DB2), respectively. B: typical psychometric and neurometric functions for standard ocular baseball (solid curves) and small-plate trials in the 2P2T experiment (dashed curves), obtained from an example SEF strike neuron. The solid and dashed arrows below the x-axis mark objective decision boundaries for standard baseball (23.2°) and small-plate 2P2T (14.0°) baseball, respectively. Solid and dashed vertical lines indicate the corresponding subjective decision boundaries derived from the computed coefficients of fits (see methods). C: cumulative percentiles for the shifts in psychometric and SEF cell neurometric functions following the decision boundary change from DB1 to DB2. Vertical lines indicate the median angular shift in the subjective decision boundary. Note that both functions are shifted to the left, consistent with a shift in the objective decision boundary from the 12° plate to the smaller 8° plate. Note also that both functions are shifted by a similar amount, indicating that the animal and neuron interpreted the decision boundary shift similarly. D: summary of the shift. Error bars indicate the SE of the mean degree of angle in shift.

Similar articles

Cited by

References

    1. Barbas H, Pandya D. Patterns of connections of the prefrontal cortex in the rhesus monkey associated with cortical architecture. In: Frontal Lobe Function and Dysfunction, edited by Levin HS, Eisenberg HM, Benton AL. New York: Oxford Univ. Press, 1991, p. 35–58
    1. Brainard DH. The psychophysics toolbox. Spat Vis 10: 433–436, 1997 - PubMed
    1. Britten KH, Newsome WT, Shadlen MN, Celebrini S, Movshon JA. A relationship between behavioral choice and the visual responses of neurons in macaque MT. Vis Neurosci 13: 87–100, 1996 - PubMed
    1. de Hemptinne C, Lefèvre P, Missal M. Neuronal bases of directional expectation and anticipatory pursuit. J Neurosci 28: 4298–4310, 2008 - PMC - PubMed
    1. Ferrera VP, Yanike M, Cassanello C. Frontal eye field neurons signal changes in decision criteria. Nat Neurosci 12: 1458–1462, 2009 - PMC - PubMed

Publication types

LinkOut - more resources