

Rapid PCR-based molecular pathotyping of H5 and H7 avian influenza viruses
- PMID: 21900520
- PMCID: PMC3209088
- DOI: 10.1128/JCM.01179-11
Rapid PCR-based molecular pathotyping of H5 and H7 avian influenza viruses
Abstract
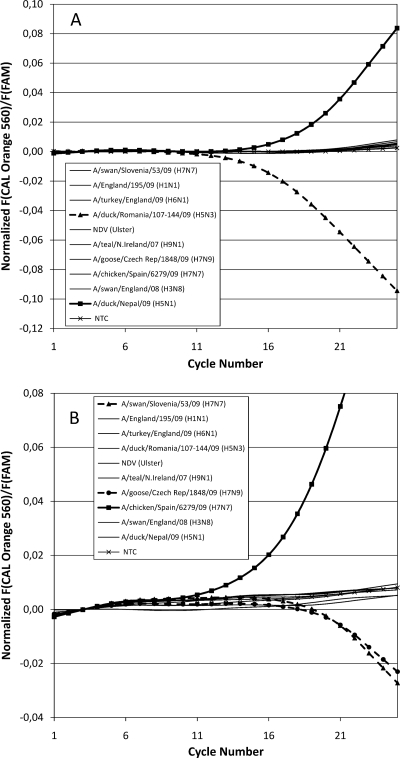
While the majority of avian influenza virus (AIV) subtypes are classified as low-pathogenicity avian influenza viruses (LPAIV), the H5 and H7 subtypes have the ability to mutate to highly pathogenic avian influenza viruses (HPAIV) in poultry and therefore are the etiological agents of notifiable AIV (NAIV). It is of great importance to distinguish HPAIV from LPAIV variants during H5/H7 outbreaks and surveillance. To this end, a novel and fast strategy for the molecular pathotyping of H5/H7 AIVs is presented. The differentiation of the characteristic hemagglutinin (HA) protein cleavage sites (CSs) of HPAIVs and LPAIVs is achieved by a novel PCR method where the samples are interrogated for all existing CSs with a 484-plex primer mixture directly targeting the CS region. CSs characteristic for HP or LP H5/H7 viruses are distinguished in a seminested duplex real-time PCR format using plexor fluorogenic primers. Eighty-six laboratory isolates and 60 characterized NAIV-positive clinical specimens from poultry infected with H5/H7 both experimentally and in the field were successfully pathotyped in the validation. The method has the potential to substitute CS sequencing in the HA gene for the determination of the molecular pathotype, thereby providing a rapid means to acquire additional information concerning NAIV outbreaks, which may be critical to their management. The new assay may be extended to the LP/HP differentiation of previously unknown H5/H7 isolates. It may be considered for integration into surveillance and control programs in both domestic and wild bird populations.
Figures
Similar articles
-
Real-time reverse transcription PCR-based sequencing-independent pathotyping of Eurasian avian influenza A viruses of subtype H7.Virol J. 2017 Jul 24;14(1):137. doi: 10.1186/s12985-017-0808-3. Virol J. 2017. PMID: 28738896 Free PMC article.
-
Validated RealTime reverse transcriptase PCR methods for the diagnosis and pathotyping of Eurasian H7 avian influenza viruses.Influenza Other Respir Viruses. 2009 Jul;3(4):151-64. doi: 10.1111/j.1750-2659.2009.00083.x. Influenza Other Respir Viruses. 2009. PMID: 19627372 Free PMC article.
-
Avian influenza viruses in New Zealand wild birds, with an emphasis on subtypes H5 and H7: Their distinctive epidemiology and genomic properties.PLoS One. 2024 Jun 3;19(6):e0303756. doi: 10.1371/journal.pone.0303756. eCollection 2024. PLoS One. 2024. PMID: 38829903 Free PMC article.
-
Intracontinental and intercontinental dissemination of Asian H5 highly pathogenic avian influenza virus (clade 2.3.4.4) in the winter of 2014-2015.Rev Med Virol. 2015 Nov;25(6):388-405. doi: 10.1002/rmv.1857. Epub 2015 Oct 13. Rev Med Virol. 2015. PMID: 26458727 Review.
-
Genetic changes that accompanied shifts of low pathogenic avian influenza viruses toward higher pathogenicity in poultry.Virulence. 2013 Aug 15;4(6):441-52. doi: 10.4161/viru.25710. Epub 2013 Jul 16. Virulence. 2013. PMID: 23863606 Free PMC article. Review.
Cited by
-
An amplicon-based nanopore sequencing workflow for rapid tracking of avian influenza outbreaks, France, 2020-2022.Front Cell Infect Microbiol. 2024 Jan 22;14:1257586. doi: 10.3389/fcimb.2024.1257586. eCollection 2024. Front Cell Infect Microbiol. 2024. PMID: 38318163 Free PMC article.
-
Real-time reverse transcription PCR-based sequencing-independent pathotyping of Eurasian avian influenza A viruses of subtype H7.Virol J. 2017 Jul 24;14(1):137. doi: 10.1186/s12985-017-0808-3. Virol J. 2017. PMID: 28738896 Free PMC article.
-
Accurate Detection of Avian Respiratory Viruses by Use of Multiplex PCR-Based Luminex Suspension Microarray Assay.J Clin Microbiol. 2016 Nov;54(11):2716-2725. doi: 10.1128/JCM.00610-16. Epub 2016 Aug 24. J Clin Microbiol. 2016. PMID: 27558184 Free PMC article.
-
Simultaneous subtyping and pathotyping of avian influenza viruses in chickens in Taiwan using reverse transcription loop-mediated isothermal amplification and microarray.J Vet Med Sci. 2016 Sep 1;78(8):1223-8. doi: 10.1292/jvms.15-0602. Epub 2016 Apr 18. J Vet Med Sci. 2016. PMID: 27086860 Free PMC article.
-
A complete map of potential pathogenicity markers of avian influenza virus subtype H5 predicted from 11 expressed proteins.BMC Microbiol. 2015 Jun 26;15:128. doi: 10.1186/s12866-015-0465-x. BMC Microbiol. 2015. PMID: 26112351 Free PMC article.
References
-
- Alexander D. J. 2000. A review of avian influenza in different bird species. Vet. Microbiol. 74:3–13 - PubMed
-
- Alexander D. J., Brown I. H. 2009. History of highly pathogenic avian influenza. Rev. Sci. Tech. 28:19–38 - PubMed
-
- Artois M., et al. 2009. Outbreaks of highly pathogenic avian influenza in Europe: the risks associated with wild birds. Rev. Sci. Tech. 28:69–92 - PubMed
-
- Banks J., Speidel E. C., McCauley J. W., Alexander D. J. 2000. Phylogenetic analysis of H7 haemagglutinin subtype influenza A viruses. Arch. Virol. 145:1047–1058 - PubMed
Publication types
MeSH terms
Substances
LinkOut - more resources
Full Text Sources
Other Literature Sources
Medical
Research Materials
Miscellaneous
