. 2011 Sep 7;31(36):12778-89.
doi: 10.1523/JNEUROSCI.2579-11.2011.

Abnormalities in the climbing fiber-Purkinje cell circuitry contribute to neuronal dysfunction in ATXN1[82Q] mice

Affiliations

Abnormalities in the climbing fiber-Purkinje cell circuitry contribute to neuronal dysfunction in ATXN1[82Q] mice

Justin A Barnes et al. J Neurosci. .

Abstract

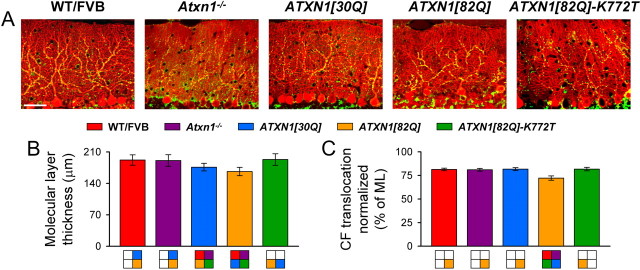
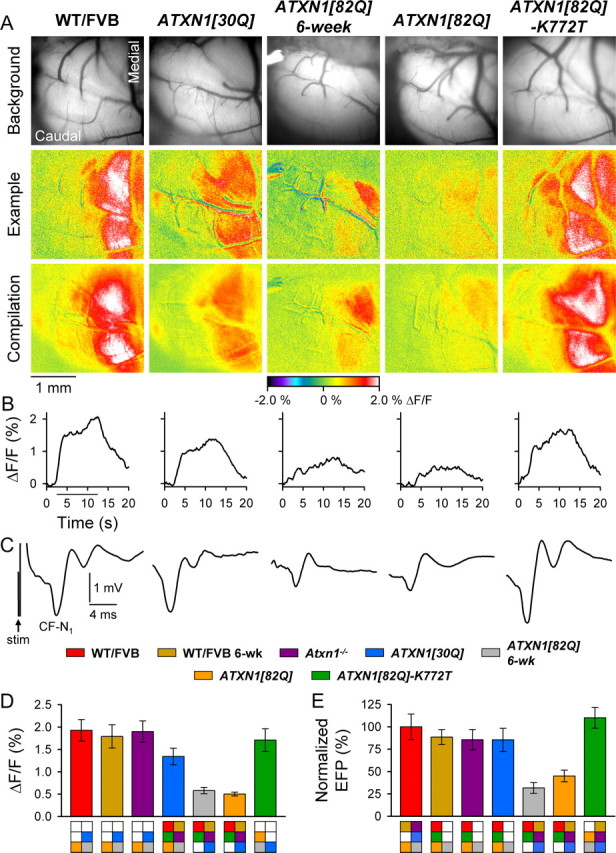
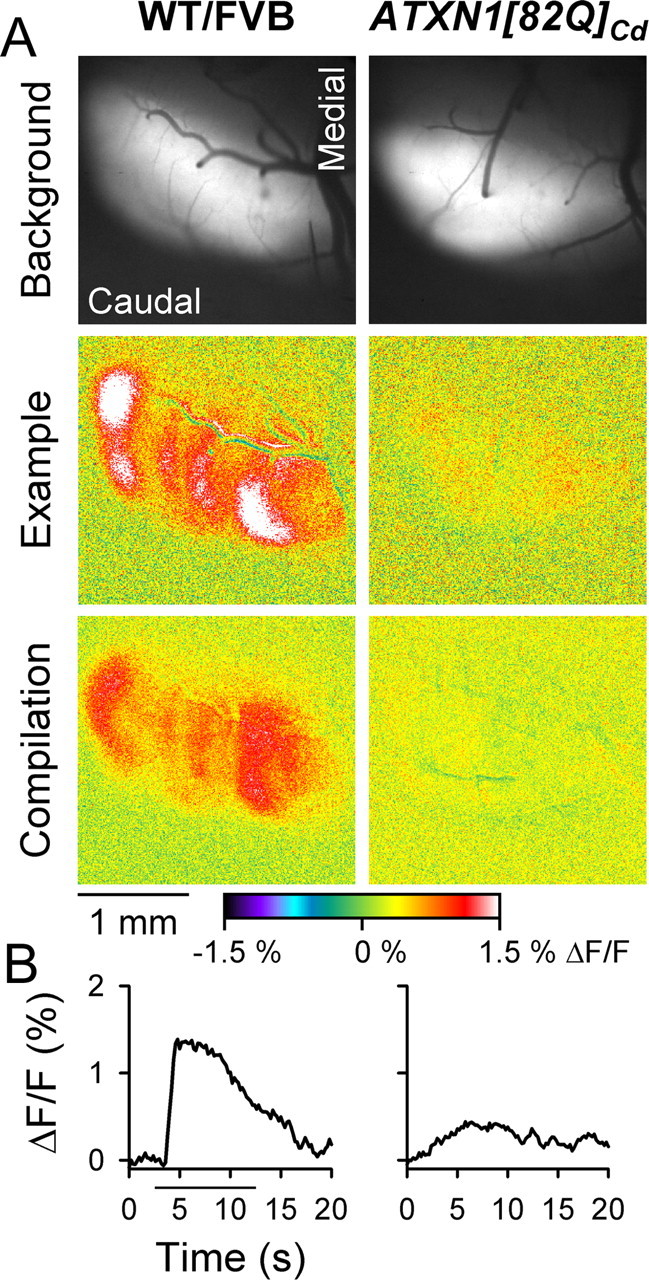
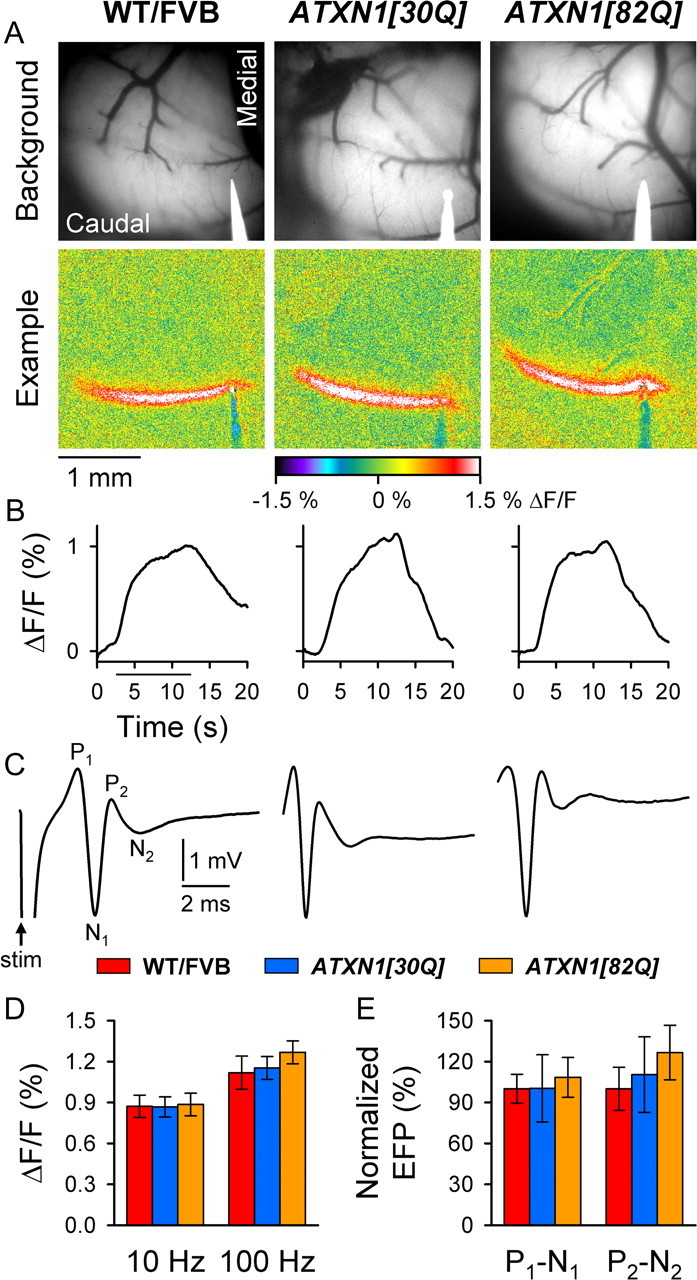
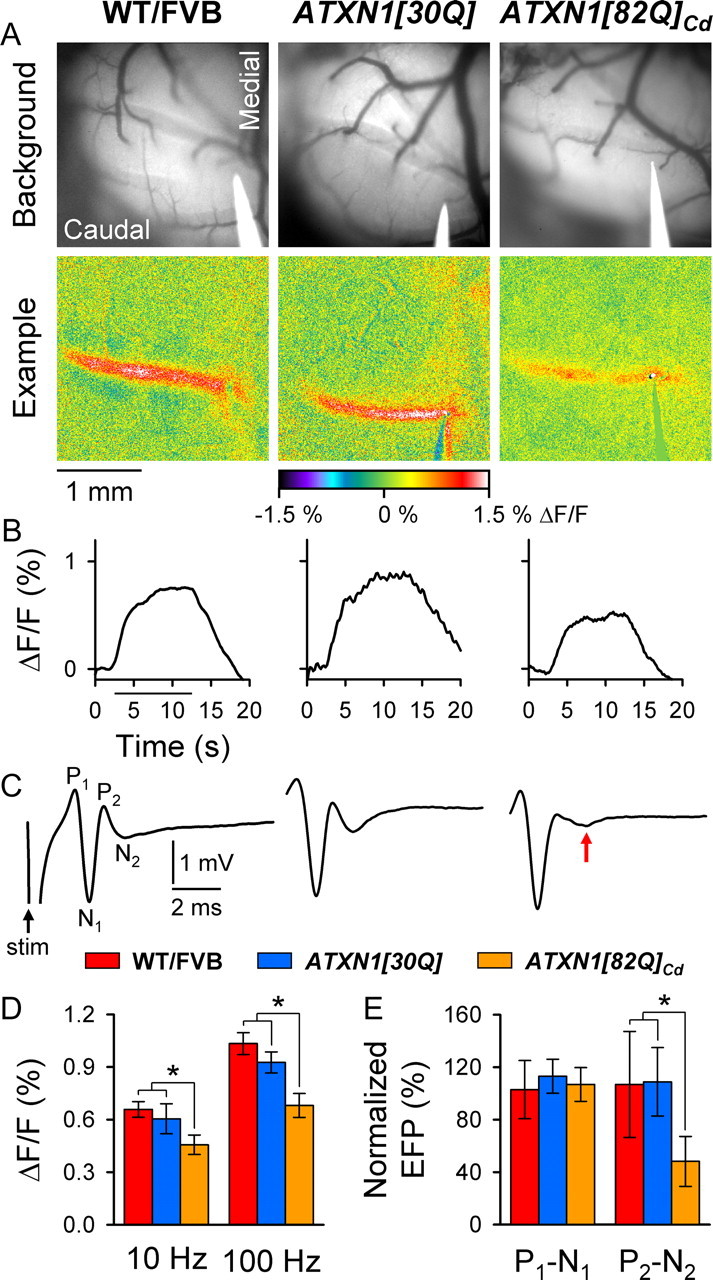
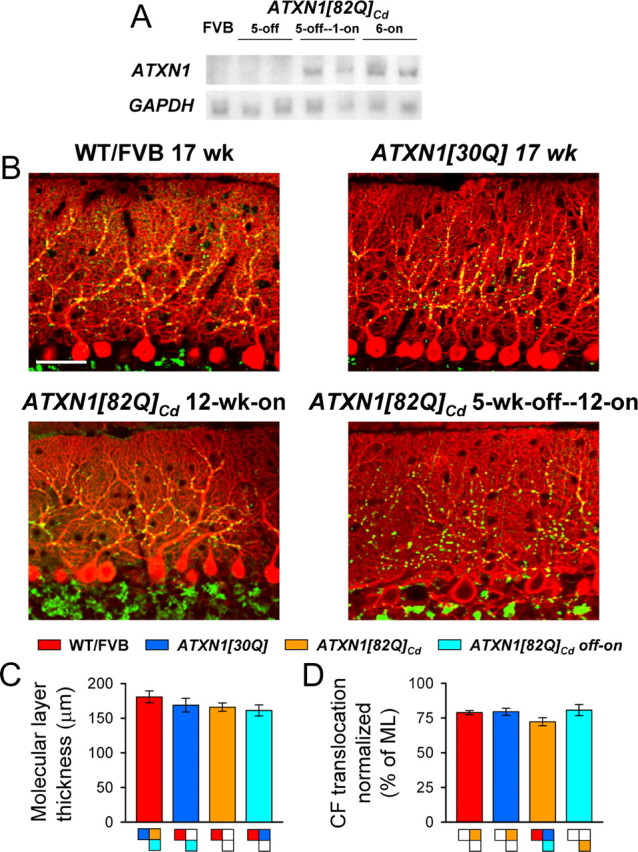
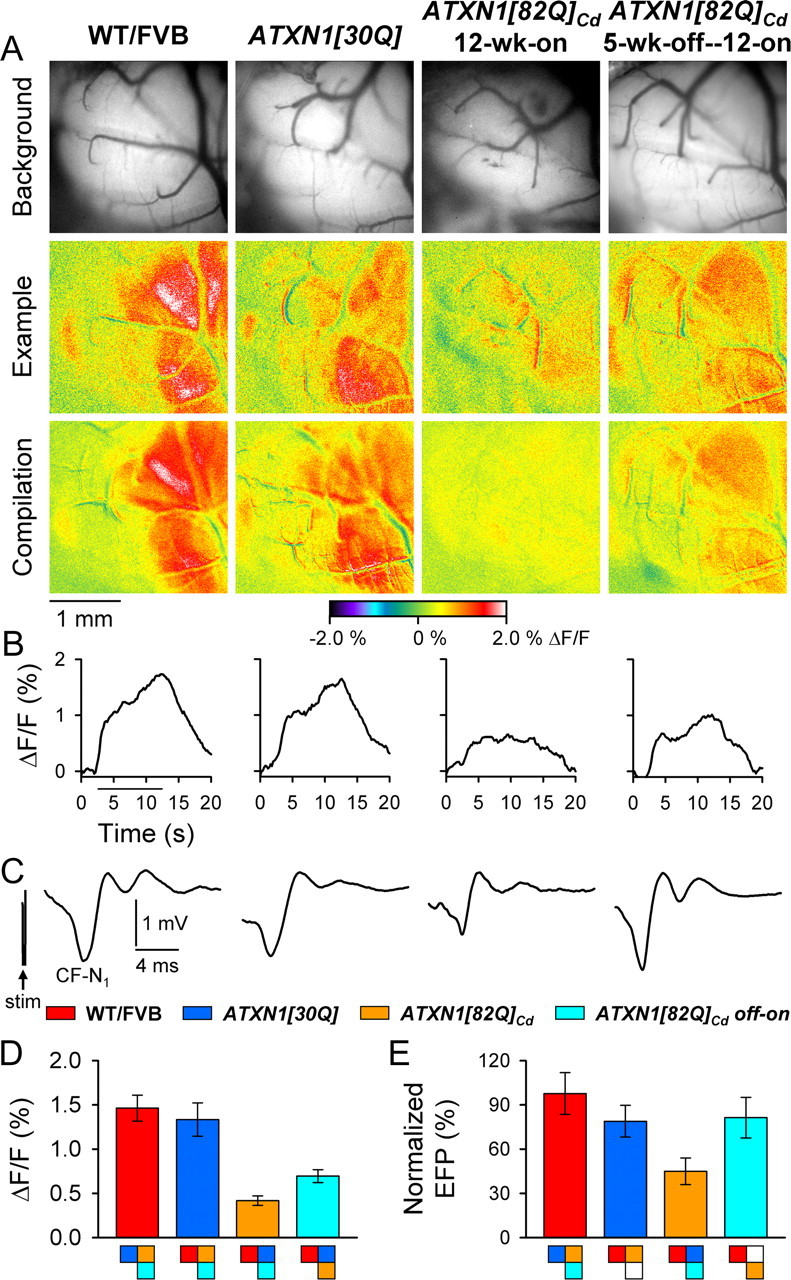
One fundamental unanswered question in the field of polyglutamine diseases concerns the pathophysiology of neuronal dysfunction. Is there dysfunction in a specific neuronal population or circuit initially that contributes the onset of behavioral abnormalities? This study used a systems-level approach to investigate the functional integrity of the excitatory cerebellar cortical circuitry in vivo from several transgenic ATXN1 mouse lines. We tested the hypotheses that there are functional climbing fiber (CF)-Purkinje cell (PC) and parallel fiber (PF)-PC circuit abnormalities using flavoprotein autofluorescence optical imaging and extracellular field potential recordings. In early-symptomatic and symptomatic animals expressing ATXN1[82Q], there is a marked reduction in PC responsiveness to CF activation. Immunostaining of vesicular glutamate transporter type 2 demonstrated a decrement in CF extension on PC dendrites in symptomatic ATXN1[82Q] mice. In contrast, responses to PF stimulation were relatively normal. Importantly, the deficits in CF-PC synaptic transmission required expression of pathogenic ataxin-1 (ATXN1[82Q]) and for its entrance into the nucleus of PCs. Loss of endogenous mouse Atxn1 had no discernible effects. Furthermore, the abnormalities in CF-PC synaptic transmission were ameliorated when mutant transgene expression was prevented during postnatal cerebellar development. The results demonstrate the preferential susceptibility of the CF-PC circuit to the effects of ATXN1[82Q]. Further, this deficit likely contributes to the abnormal motor phenotype of ATXN1[82Q] mice. For polyglutamine diseases generally, the findings support a model whereby specific neuronal circuits suffer insults that alter function before cell death.


Figures

Figure 1.
Figure 1.
Reduced CF translocation and molecular layer thinning in 12-week-old ATXN1[82Q] mice. A, Immunofluorescently labeled sagittal cerebellar sections show calbindin-positive PCs (red) and VGLUT2-positive CF terminals (green). Images were taken at 20×. Scale bar, 50 μm. B, Molecular layer (ML) thickness at the primary fissure. C, CF terminal translocation measured as a percentage of total molecular layer thickness. N = 3 animals; n = 54 measurements per genotype. All results are reported as the mean ± SEM. Colors in boxes below graphs correspond to statistically significant differences (p < 0.01 for all Bonferroni post hoc comparisons) between the bar immediately superior and the box of the specified color, while a lack of color denotes no significant difference.
Figure 2.
Figure 2.
Reduced response to CIO stimulation in 6- and 12-week-old ATXN1[82Q] mice. A, Background images of exposed cerebella (top row), pseudocolored images from individual animals (middle row), and compilation images from each genotype (bottom row) demonstrate characteristic response patterns to CIO stimulation. B, Time courses for single trials illustrate typical changes in flavoprotein autofluorescence over the duration of CIO stimulation (horizontal bar). C, Representative FPs evoked by CIO stimulation for each genotype. The stimulation artifact is shown only for WT/FVB. D, E, Quantification of CF-mediated flavoprotein autofluorescence responses and CF-N1 of the FP. WT/FVB: N = 11 animals; n = 60 observations for both autofluorescent flavoprotein imaging (AFI) and FPs; 6-week-old WT/FVB mice: N = 5, n = 40 for AFI; and N = 4, n = 32 for FPs; Atxn1−/− mice: N = 4, n = 32; ATXN1[30Q] mice: N = 8, n = 60 for AFI; and N = 7, n = 51 for FPs; 6-week-old ATXN1[82Q] mice: N = 4, n = 32; 12-week-old ATXN1[82Q] mice: N = 4, n = 32; ATXN1[82Q]-K772T mice: N = 4, n = 32. Boxes denote significant differences.
Figure 3.
Figure 3.
Diminished Ca2+ responses to CIO stimulation in ATXN1[82Q]Cd animals. A, Background fluorescence of Oregon Green-stained cerebella (top row) and pseudocolored images demonstrate changes in [Ca2+]i following CIO stimulation in single animals (middle rows) and compilations (bottom row) from 12-week-old WT/FVB and ATXN1[82Q]Cd mice. B, Time courses of fluorescence changes from single animals to CIO stimulation (horizontal bar).
Figure 4.
Figure 4.
Responses to PF stimulation are indistinguishable in all genotypes. A, Background images of exposed cerebella (top row) and pseudocolored images from individual animals (bottom row) demonstrate characteristic PF-mediated responses to low-frequency (10 Hz) cerebellar cortical surface stimulation. B, Time courses of low-frequency, PF-mediated changes in flavoprotein autofluorescence. C, FPs demonstrate the characteristic P1-N1-P2-N2 waveform following surface stimulation. The stimulation artifact is shown only for WT/FVB mice. D, E, Quantification of flavoprotein autofluorescence responses and FPs to PF stimulation. WT/FVB mice: N = 25 animals, n = 75 observations for 10 Hz; N = 13 animals, n = 39 observations for 100 Hz; and N = 12, n = 35 for FPs; ATXN1[30Q] mice: N = 21, n = 63 for 10 Hz; N = 16, n = 48 for 100 Hz; and N = 8, n = 28 for FPs; 12-week-old ATXN1[82Q] mice: N = 7, n = 21 for autofluorescent flavoprotein imaging; and N = 4, n = 30 for FPs. stim, Stimulation.
Figure 5.
Figure 5.
Responses to PF stimulation decline most significantly in 40-week-old ATXN1[82Q]Cd mice. A, Background images of exposed cerebella (top row) and pseudocolored images from individual animals (bottom row) demonstrate characteristic PF-mediated responses to low-frequency PF stimulation. B, Time courses of the changes in flavoprotein autofluorescence evoked by PF stimulation. C, Representative PF-mediated FP traces illustrate typical P1-N1-P2-N2 responses. The red arrow indicates a reduced postsynaptic (P2-N2) component in ATXN1[82Q]Cd mice. D, Quantification of flavoprotein autofluorescence responses following low- and high-frequency (100 Hz) PF stimulation. E, Comparison of the presynaptic and postsynaptic components of the PF-mediated FP. WT/FVB mice: N = 9 animals, n = 27 observations for autofluorescent flavoprotein imaging (AFI); and N = 5 animals, n = 33 for FPs; ATXN1[30Q] mice: N = 4, n = 12 for AFI; and N = 3, n = 24 for FPs; ATXN1[82Q]Cd mice: N = 9, n = 27 for AFI; and N = 3, n = 24 for FPs. *p < 0.00625.
Figure 6.
Figure 6.
CF translocation is normal in 5-week-off—12-week-on ATXN1[82Q]Cd mice. A, Northern blot probed for ATXN1 transgene expression (top row) and GAPDH (bottom row) in 5-week-gene-off, 5-week-gene-off—1-week-gene-on, 6-week-gene-on ATXN1[82Q]Cd mice. B, Immunofluorescently stained sagittal cerebellar sections visualize calbindin-positive PCs (red) and VGLUT2-positive CF terminals (green) in 17-week-old control mice (top row) and 12-week-gene-on ATXN1[82Q]Cd and 5-week-off—12-week-on ATXN1[82Q]Cd animals (bottom row). Scale bar, 50 μm. C, Molecular layer (ML) thickness at the primary fissure. D, CF translocation measured as a percentage of molecular layer thickness. For all genotypes: N = 3 animals, n = 54 observations. Boxes denote significant differences (p < 0.01).
Figure 7.
Figure 7.
CF–PC synaptic transmission improves in 5-week-off—12-week-on ATXN1[82Q]Cd mice. A, Background images of exposed cerebella (top row), pseudocolored images from individual animals (middle row), and compilation images from each genotype (bottom row) demonstrate characteristic response patterns following CIO stimulation. B, Time courses of the changes in flavoprotein fluorescence in the cerebellar cortex evoked by CIO stimulation. C, Example traces illustrate characteristic CIO-mediated FPs. D, E, Quantification of flavoprotein autofluorescence responses and CF-N1. WT/FVB mice: N = 5 animals, n = 41 observations for both autofluorescent flavoprotein imaging and FPs; ATXN1[30Q]: N = 4, n = 31; 12-week-on ATXN1[82Q]Cd mice: N = 6, n = 25; 5-week-off—12-week-on ATXN1[82Q]Cd mice: N = 3, n = 24. Boxes denote significant differences (p < 0.01).

References

    1. Budd SL, Nicholls DG. A reevaluation of the role of mitochondria in neuronal Ca2+ homeostasis. J Neurochem. 1996;66:403–411. - PubMed
    1. Burright EN, Clark HB, Servadio A, Matilla T, Feddersen RM, Yunis WS, Duvick LA, Zoghbi HY, Orr HT. SCA1 transgenic mice: a model for neurodegeneration caused by an expanded CAG trinucleotide repeat. Cell. 1995;82:937–948. - PubMed
    1. Chance B. The energy-linked reaction of calcium with mitochondria. J Biol Chem. 1965;240:2729–2748. - PubMed
    1. Chen G, Popa LS, Wang X, Gao W, Barnes J, Hendrix CM, Hess EJ, Ebner TJ. Low frequency oscillations in the cerebellar cortex of the tottering mouse. J Neurophysiol. 2009;101:234–245. - PMC - PubMed
    1. Chen X, Tang TS, Tu H, Nelson O, Pook M, Hammer R, Nukina N, Bezprozvanny I. Deranged calcium signaling and neurodegeneration in spinocerebellar ataxia type 3. J Neurosci. 2008;28:12713–12724. - PMC - PubMed

Publication types

MeSH terms

LinkOut - more resources