. 2011 Sep 7;31(36):12855-65.
doi: 10.1523/JNEUROSCI.1457-11.2011.

Variability of the relationship between electrophysiology and BOLD-fMRI across cortical regions in humans

Affiliations

Variability of the relationship between electrophysiology and BOLD-fMRI across cortical regions in humans

Christopher R Conner et al. J Neurosci. .

Abstract

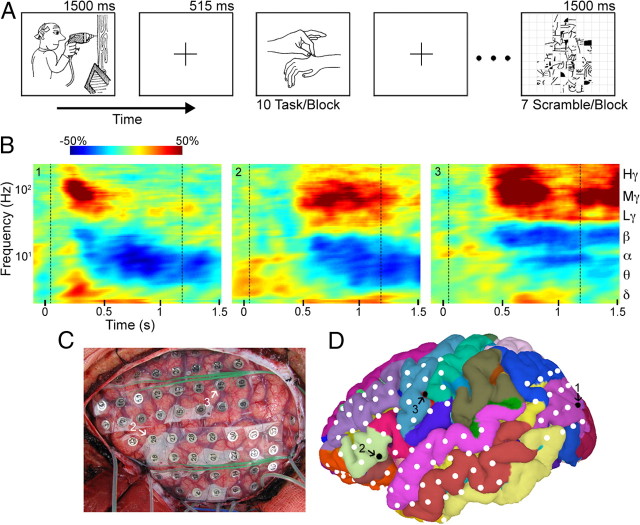
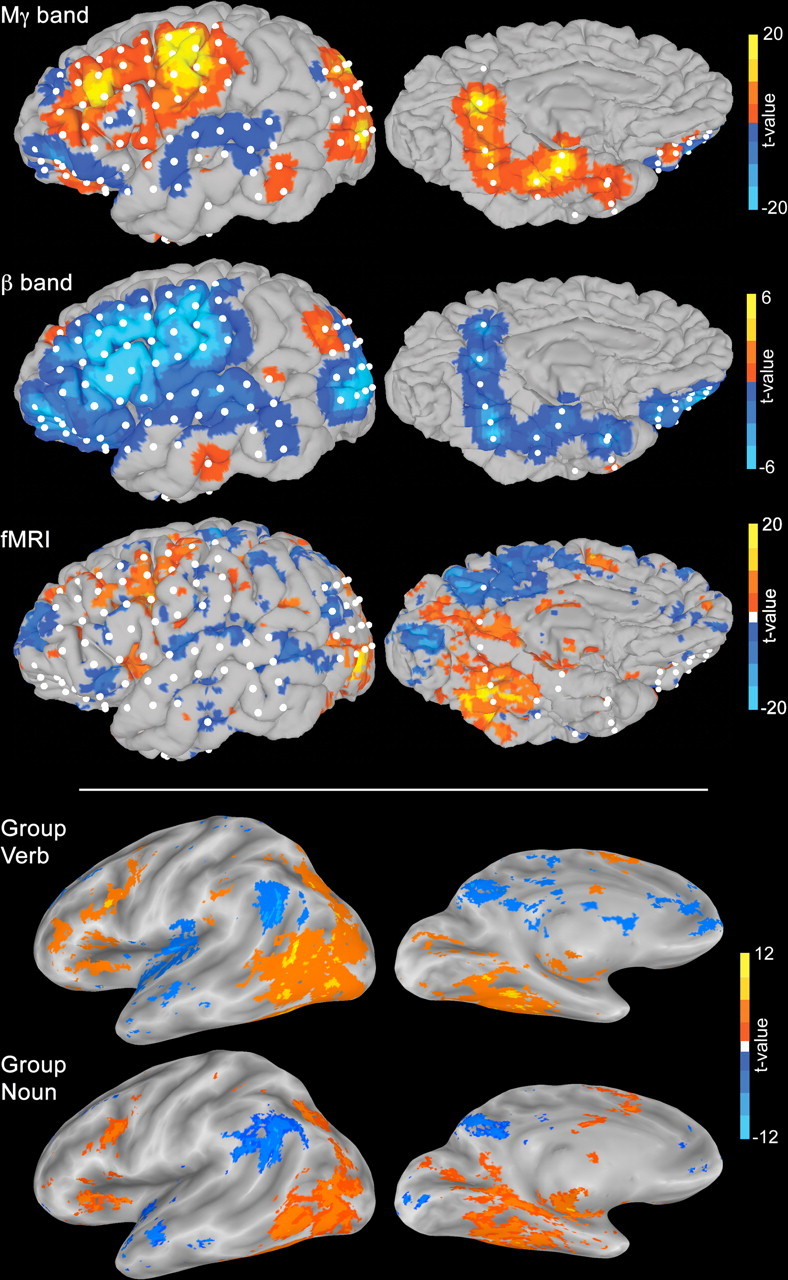
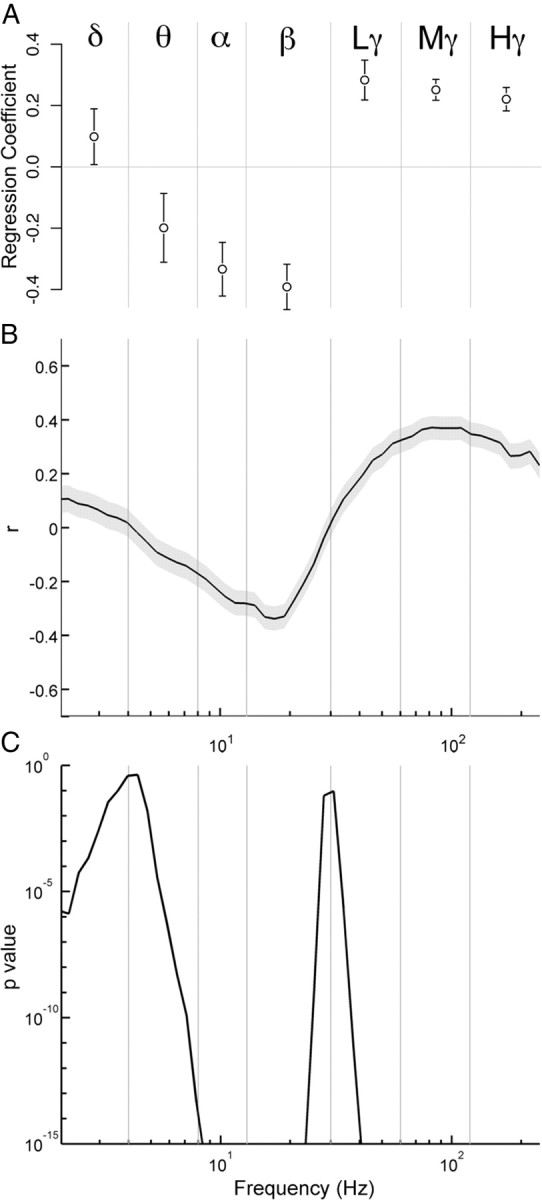
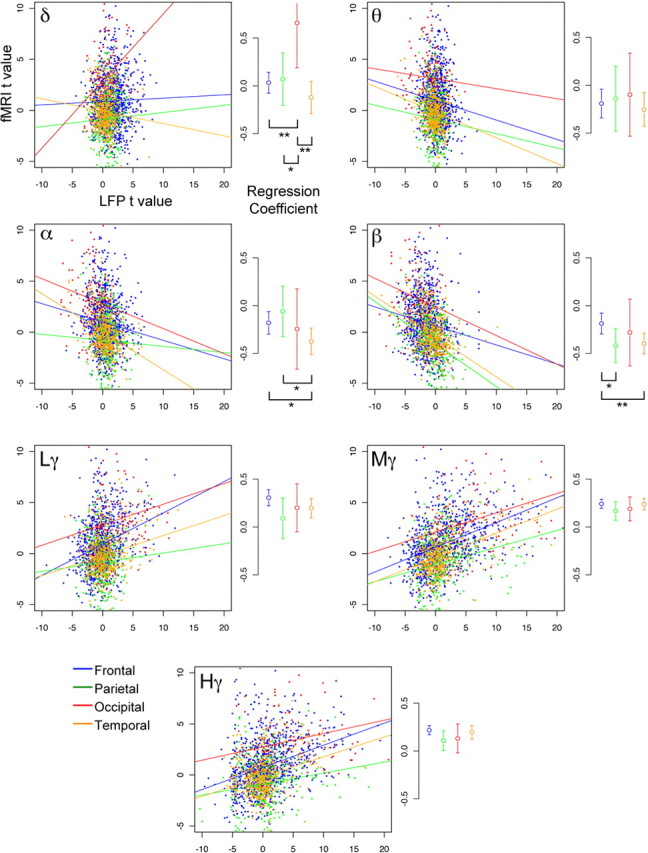
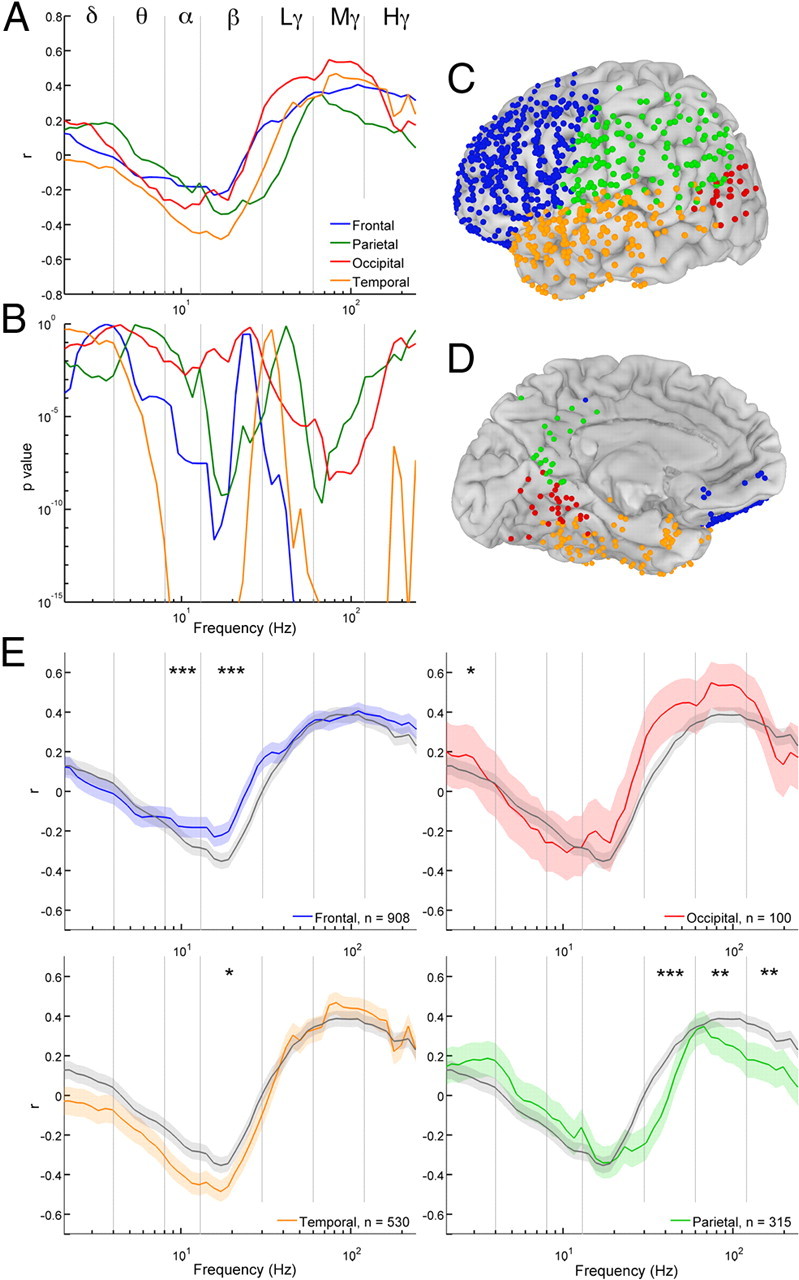
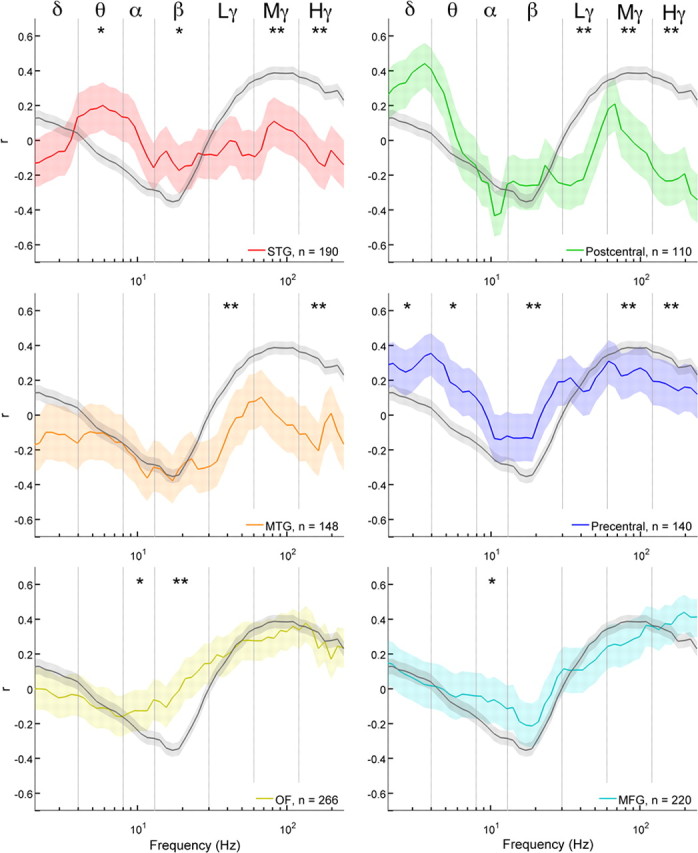
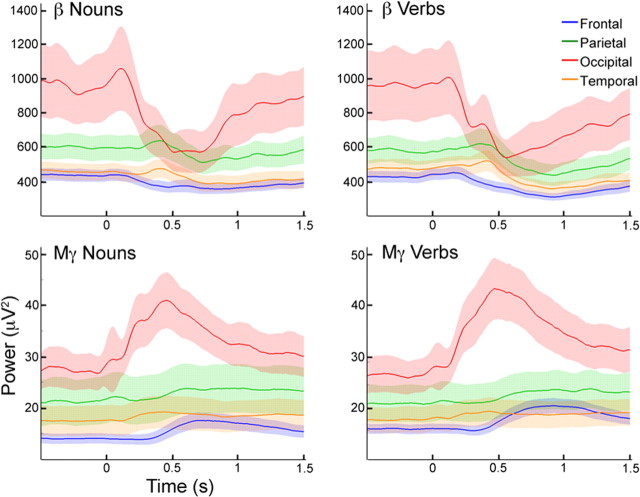
The relationship between blood oxygenation level-dependent (BOLD) functional MRI (fMRI) signal and the underlying neural electrical activity in humans is a topic of intense interest to systems neuroscience. This relationship has generally been assumed to be invariant regardless of the brain region and the cognitive task being studied. We critically evaluated these assumptions by comparing the BOLD-fMRI response with local field potential (LFP) measurements during visually cued common noun and verb generation in 11 humans in whom 1210 subdural electrodes were implanted. As expected, power in the mid-gamma band (60-120 Hz) correlated positively (r(2) = 0.16, p < 10(-16)) and power in the beta band (13-30 Hz) correlated negatively (r(2) = 0.09, p < 10(-16)) with the BOLD signal change. Beta and mid-gamma band activity independently explain different components of the observed BOLD signal. Importantly, we found that the location (i.e., lobe) of the recording site modulates the relationship between the electrocorticographic (ECoG) signal and the observed fMRI response (p < 10(-16), F(21,1830) = 52.7), while the type of language task does not. Across all brain regions, ECoG activity in the gamma and beta bands explains 22% of the fMRI response, but if the lobar location is considered, 28% of the variance can be explained. Further evaluation of this relationship at the level of individual gyri provides additional evidence of differences in the BOLD-LFP relationship by cortical locus. This spatial variability in the relationship between the fMRI signal and neural activity carries implications for modeling of the hemodynamic response function, an essential step for interregional fMRI comparisons.


Figures

Figure 1.
Figure 1.
Representation of experimental paradigm and the spectral changes in the LFPs. A, Examples of visual stimuli for verb generation on screen for 1500 ms during both fMRI and ECoG acquisition. The TR during fMRI acquisition was 2015 ms. Each fMRI block consisted of 10 images of verb or noun stimuli followed by 7 images of scrambled versions of the same stimuli. B, Spectrograms for a single subject computed using analytic signal processing. Spectrogram 1, V1; spectrogram 2, Broca's area (pars triangularis); spectrogram 3, M1 mouth. Spectral changes are depicted as percentage increases in power over a prestimulus baseline. The correlation between fMRI and LFP was carried out using t statistics computed from the task vs the scrambled images condition. The time window between the vertical dotted lines in each graph, from 50 ms to mean reaction time minus one standard deviation, was averaged over trials to get the mean responses. C, Intraoperative photograph obtained after placement of subdural electrodes on the left hemisphere. D, Representation of the same SDEs as spheres on a 3D automatically parcellated cortical surface generated using the same patient's MRI scan.
Figure 2.
Figure 2.
Representation of cortical activity during naming tasks versus viewing scrambled images. The top three rows represent data from a single illustrative patient during visually cued noun generation contrasted with scrambled images. Activity measured by ECoG in the mid-gamma (Mγ) band (60–120 Hz, top row) and the beta (β) band (13–30 Hz, second row) and by BOLD-fMRI (third row) is represented on the cortical surface to allow for direct visual comparison. The fMRI data shown here were unconstrained by the 8 mm VOIs placed around each electrode in the analysis to give a complete representation of all activation. While unthresholded fMRI and LFP data were used in the correlation, for illustrative purposes this fMRI dataset is thresholded at p < 0.001. The lower two rows depict fMRI analysis for the entire group (n = 11) displayed on the inflated gray–white junction for verb (fourth row) and noun (fifth row) generation (p < 0.01).
Figure 3.
Figure 3.
Correlation between the BOLD signal and the ECoG across brain regions. Data are from all 11 individuals (n = 1210 electrodes) during both naming tasks. Electrodes with electrical artifact and those overlying abnormal cortex or brain regions affected by susceptibility artifact during EPI acquisition were excluded. The total number of electrodes sites used in this comparison was 1853 (926 during noun and 927 during verb generation respectively). Neither fMRI nor ECoG datasets were thresholded before correlation. An 8 mm VOI around each ECoG electrode was used to sample the fMRI data. A, Regression coefficients with 99% CIs between ECoG activity in each canonical band. B, C, Pearson's r values with 99% CI (computed using Fisher's z statistic) (B) and the associated p values (C), analyzed using 50 frequency bins on a logarithmic scale from 2 to 240 Hz, with logarithmic width from 4 to 40 Hz. The inverse correlation at low frequencies (alpha and beta bands) inflects to a positive correlation at about 30 Hz (start of the gamma band). Different correlation values are noted in the low- (Lγ; 30–60 Hz), mid- (Mγ; 60–120), and high-gamma (Hγ; 120–240) bands with a peak around 90–100 Hz.
Figure 4.
Figure 4.
Correlations for each frequency band separated by lobe. Scatter plots of the data used in the lobe-specific regressions (Fig. 5) illustrate the differences between correlations across lobes. LFP power is plotted against fMRI power for each of the seven bands used in the comparison. Linear models fitted using each of frontal (blue), parietal (green), occipital (red), and temporal (orange) separately show significant variation in regression of LFP band power on fMRI-BOLD response at low frequencies. Regression coefficients (the slope of the regression line; Fig. 3A) for each band (along with 99% CI, uncorrected) show that direction, magnitude, and variability are all location and band specific. Comparisons of the LBC function for each lobe against the others were performed to test for significant differences (*p < 0.01, **p < 0.001). Significant differences were noted in low-frequency bands (delta, alpha, beta) but not in their higher-frequency counterparts (gamma). Differences were present in the beta band despite the fact that it was a significant regressor in the final linear model (see Results), further supporting the differences in the LBC function across lobes.
Figure 5.
Figure 5.
Effects of location on the correlation between the local field potential and the fMRI signal change. Data from both tasks (noun and verb naming) were pooled together as in Figure 3. A, B, Pearson's r (A) and p (B) values at each frequency bin are computed as a function of lobar location of the recording electrode. Significance of correlation was strongly affected by numbers of electrodes; therefore, lobes with the greatest numbers of samples (frontal and temporal) had the highest levels of significance. C, D, Locations and distributions of electrodes are shown colocalized on a single brain surface to which they were registered using a 12 parameter affine transform. The number of electrodes included in the analysis varied slightly between the two tasks (due to slight variations in noisy channels between the recording sessions for each task). In both tasks there were 454 electrodes over the frontal lobe and 265 over the temporal lobe. During verb naming there were 157 electrodes over the parietal lobe and 51 over the occipital lobe, while in common naming there were 158 and 49, respectively. E, The mean correlation values for each lobe with 95% CIs are plotted. Mean response with 95% CIs across all electrodes is plotted in gray. Significance levels: *p < 0.01, **p < 0.001, ***p < 0.00001.
Figure 6.
Figure 6.
Variance in the function of LFP-BOLD coupling, LBC, across specific gyri. Total numbers of electrodes contributing to each group are shown in each graph. The gray line represents the correlation for all electrodes used in the analysis (Fig. 3B), while each of the colored lines contain only those electrodes at a specific gyrus. The shaded error bars around both lines reflect an uncorrected p < 0.05. Significant deviations in correlation from the group are noted in STG, postcentral gyrus, MTG, precentral gyrus, orbitofrontal cortex (OF), and middle frontal gyrus (MFG). Differences in the LBC relationship occur in all seven frequency bands. Significance levels: *p < 0.01, **p < 0.001.
Figure 7.
Figure 7.
LFP-BOLD coupling for regions determined as essential for language by cortical stimulation mapping, CSM. A, Electrodes were transformed to a common surface and then color coded based on the CSM results. Electrodes were classified as CSM positive (red), negative (black), or motor only (green). Electrodes that were not tested are displayed as white. BD, Sites that were CSM positive for receptive or expressive language (not just visual naming) were located in Broca's area (n = 25) (B), STG (n = 40) (C), and MTG (D) (n = 10). LBC curves of CSM-positive versus negative sites in these three regions were compared. The shaded error bars depict an uncorrected p < 0.05 and the gray line represents all other electrodes used in the analysis (see Fig. 3B). Significant differences were noted between CSM-positive and CSM-negative sites in the gamma band correlation for all three gyri (*p < 0.01, **p < 0.001).
Figure 8.
Figure 8.
Changes in ECoG power from baseline during task performance. For each lobe, the time course of beta and mid-gamma (Mγ) power at each electrode was computed from 500 ms before stimulus onset to 1500 ms after. The average and 95% CI are plotted for all electrodes in each lobe. Task related attenuation in beta power was noted in both tasks after stimulus onset, concurrent with an increase in power in the mid-gamma band. Resting power in both bands was greatest in the occipital lobe and lowest in frontal cortex.

Similar articles

Cited by

References

    1. Angenstein F, Kammerer E, Scheich H. The BOLD response in the rat hippocampus depends rather on local processing of signals than on the input or output activity. A combined functional MRI and electrophysiological study. J Neurosci. 2009;29:2428–2439. - PMC - PubMed
    1. Brown EC, Rothermel R, Nishida M, Juhász C, Muzik O, Hoechstetter K, Sood S, Chugani HT, Asano E. In vivo animation of auditory-language-induced gamma-oscillations in children with intractable focal epilepsy. Neuroimage. 2008;41:1120–1131. - PMC - PubMed
    1. Bruns A. Fourier-, Hilbert- and wavelet-based signal analysis: are they really different approaches? J Neurosci Methods. 2004;137:321–332. - PubMed
    1. Cardin JA, Carlén M, Meletis K, Knoblich U, Zhang F, Deisseroth K, Tsai LH, Moore CI. Driving fast-spiking cells induces gamma rhythm and controls sensory responses. Nature. 2009;459:663–667. - PMC - PubMed
    1. Cohen J, Cohen P. Ed 2. Hillsdale, NJ: Lawrence Erlbaum; 1983. Applied multiple regression/correlation analysis for the behavioral sciences.

Publication types

MeSH terms