. 2011 Sep 7;31(36):12889-99.
doi: 10.1523/JNEUROSCI.1309-11.2011.

Vulnerability to depression: from brain neuroplasticity to identification of biomarkers

Affiliations

Vulnerability to depression: from brain neuroplasticity to identification of biomarkers

Aurélie Blugeot et al. J Neurosci. .

Abstract

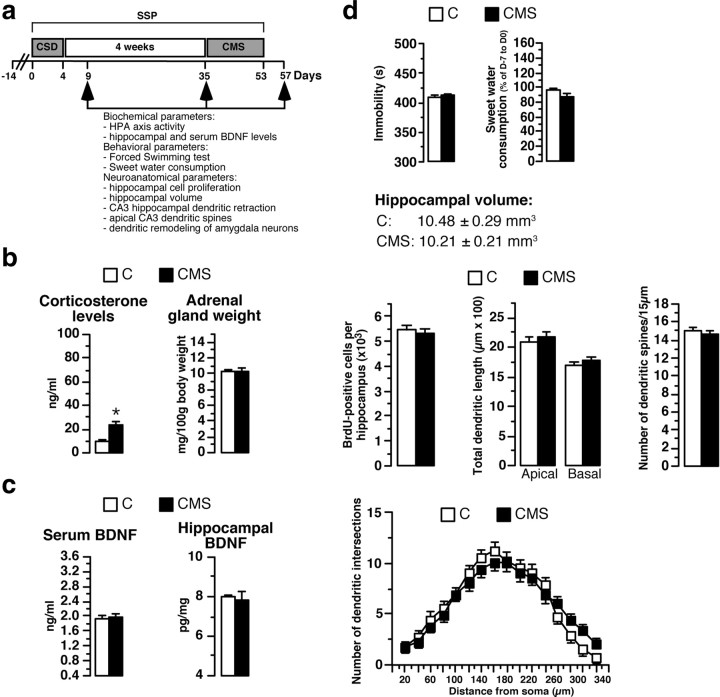
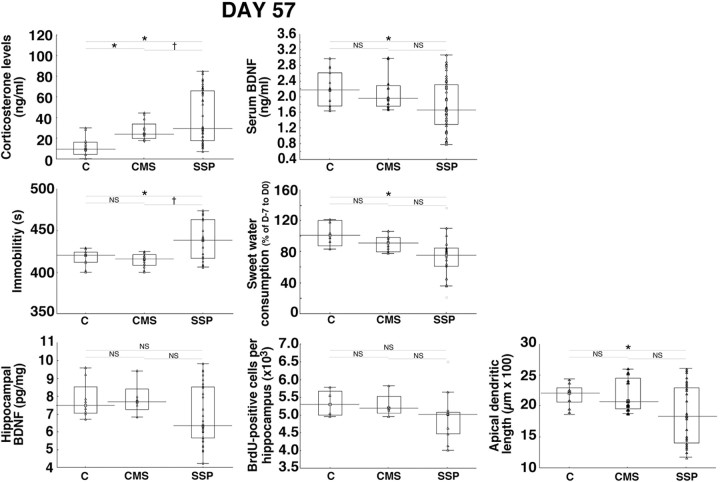
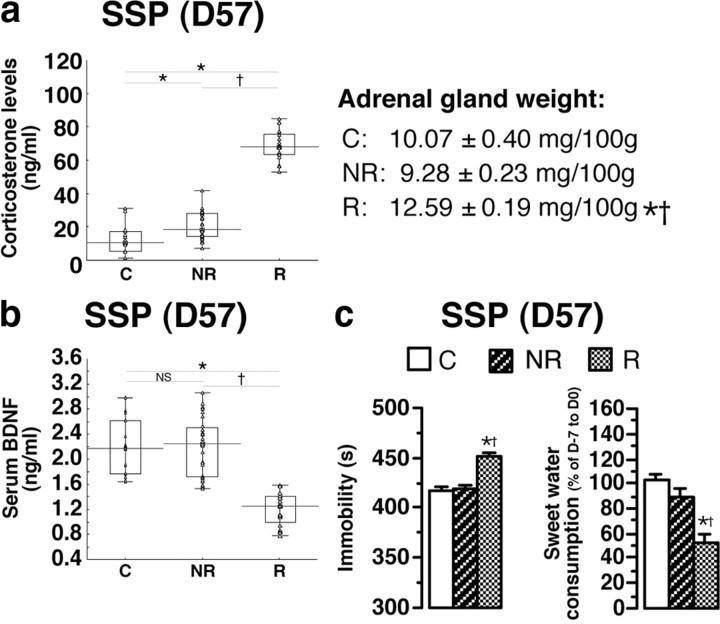
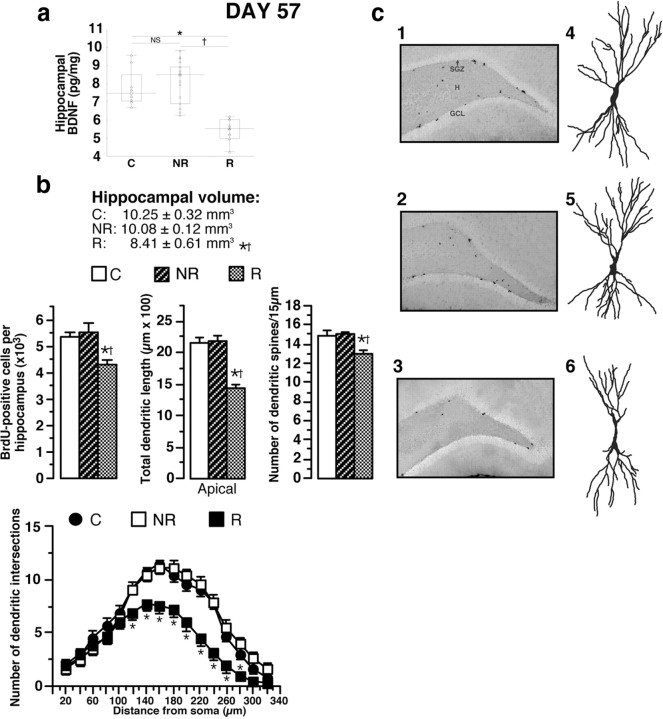
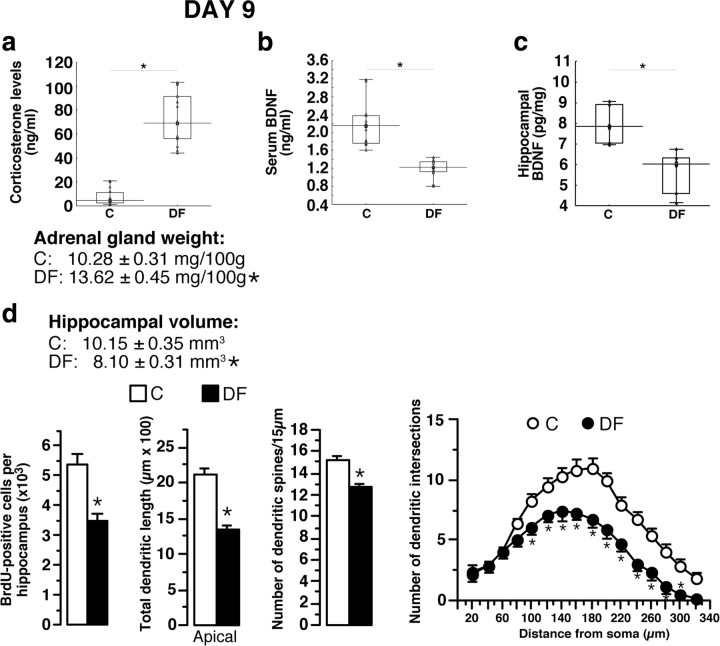
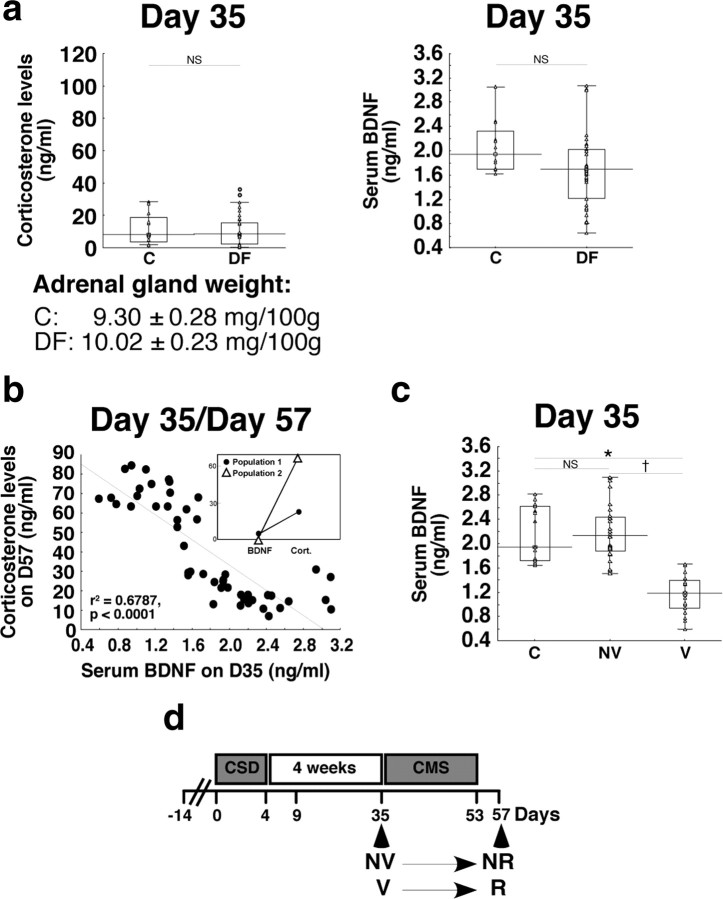
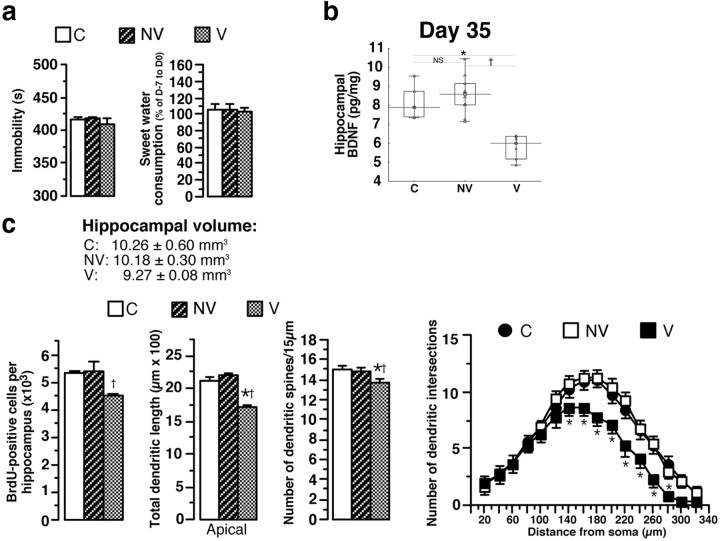
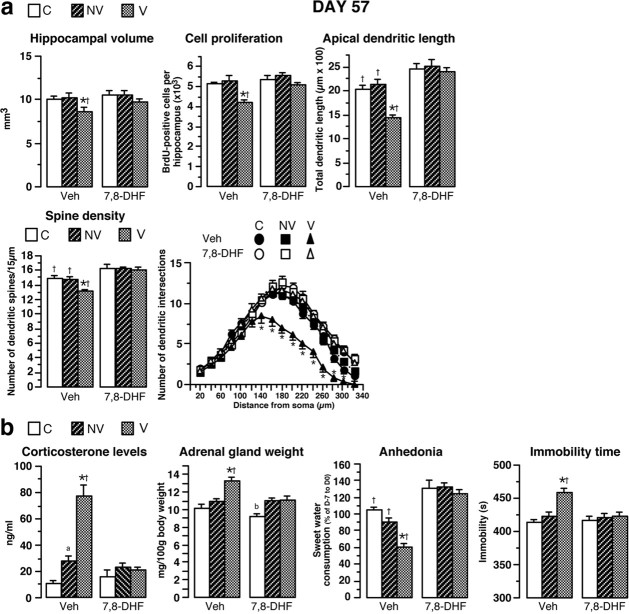
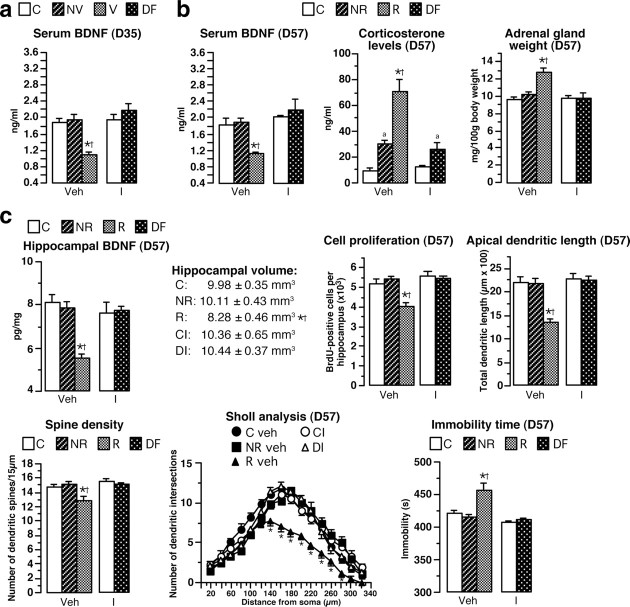
A stressful event increases the risk of developing depression later in life, but the possible predisposing factors remain unknown. Our study aims to characterize latent vulnerability traits underlying the development of depressive disorders in adult animals. Four weeks after a priming stressful event, serum corticosterone concentration returned to control values in all animals, whereas the other biological parameters returned to basal level in only 58% of animals (called nonvulnerable). In contrast, 42% of animals displayed persistent decreased serum and hippocampus BDNF concentrations, reduced hippocampal volume and neurogenesis, CA3 dendritic retraction and decrease in spine density, as well as amygdala neuron hypertrophy, constituting latent vulnerability traits to depression. In this group, called vulnerable, a subsequent mild stress evoked a rise of serum corticosterone levels and a "depressive" phenotype, in contrast to nonvulnerable animals. Intracerebroventricular administration of 7,8-dihydroxyflavone, a selective TrkB receptor agonist, dampened the development of the "depressive" phenotype. Our results thus characterize the presence of latent vulnerability traits that underlie the emergence of depression and identify the association of low BDNF with normal corticosterone serum concentrations as a predictive biomarker of vulnerability to depression.


Figures

Figure 1.
Figure 1.
Effects of the 3 week CMS protocol alone on biochemical, neuroanatomical, and behavioral parameters. a, The SSP involved subjecting animals to CSD and then, 4 weeks later, to CMS. Biochemical, behavioral, and neuroanatomical parameters were measured 5 d (D9) or 4 weeks (D35) after the end of the social-defeat procedure and 5 d after the end of the CMS protocol (D57). b, HPA axis activity in rats subjected to 3 weeks of CMS without prior social defeat (n = 12) and in control rats (animals with no history of social defeat and CMS; n = 12). c, Determination of serum and hippocampal BDNF concentrations in CMS animals (n = 6–12) and C rats (n = 5–12). d, Immobility time in the FST, sweet water consumption, hippocampal volume, number of BrdU-positive hippocampal cells, total apical and basal dendrite lengths of CA3 hippocampal neurons, and spine density in CMS rats (n = 4–8) and C animals (n = 4–8). Sholl analysis for CMS rats and C animals is shown. *p < 0.05 versus C rats.
Figure 2.
Figure 2.
Sensitization procedure induces interindividual variability. At D57, serum corticosterone and BDNF concentrations, immobility time in the FST, sweet water consumption, hippocampal BDNF concentrations, number of BrdU-positive hippocampal cells, and apical dendrite length of CA3 hippocampal neurons for animals subjected to the SSP (n = 9–48), control rats (animals with no history of social defeat and CMS, n = 4–15), and CMS rats (n = 4–12) are shown. Data presented as box plots show the 25th and 75th percentiles. The bars in the boxes represent the medians. Circles represent atypical values. *p < 0.05 versus C rats; p < 0.05 versus CMS rats.
Figure 3.
Figure 3.
Segregation of rats submitted to the SSP into responder (depressive) and nonresponder (nondepressive) animal populations. a, Based on the corticosterone concentrations measured in CMS rats, the highest corticosterone level (43.94 ng/ml) was set as a cutoff for splitting the SSP animal population into two subpopulations: those with values of >43.94 ng/ml, named responder rats (n = 20) and those with values of <43.94 ng/ml, called nonresponder rats (n = 28). b, Distinct serum BDNF concentrations between R, NR, and C (n = 15) animals. c, Evaluation of depression-like profile by the FST and the sweet water consumption of R, NR, and C animals (n = 8–12). Data presented as box plots show the 25th and 75th percentiles. The bars in the boxes represent the medians. *p < 0.05 versus C rats; p < 0.05 versus NR rats.
Figure 4.
Figure 4.
Responder (depressive) and nonresponder (nondepressive) animal populations displayed distinct neuroanatomical alterations at the end of the SSP. a, At D57, hippocampal BDNF concentrations in responder animals (n = 12), nonresponder (n = 18), and control rats (n = 8). b, The low hippocampal BDNF concentrations in R animals were associated with a lower hippocampal volume, a smaller number of BrdU-positive hippocampal cells, a retraction of apical CA3 hippocampal dendrites, and a decrease of dendritic spines. Sholl analysis for C, NR, and R animals is shown. c, Representative BrdU-labeled sections of the dentate gyrus (1, 2, 3; 50× magnification) and Golgi-stained hippocampal CA3 neurons (4–6) from control (1, 4), nonresponder (2, 5), and responder (3, 6) animals. Most of the BrdU-labeled cells are located in the subgranular zone (SGZ), the area between the GCL and the hilus (H) in the hippocampus. Data presented as box plots show the 25th and 75th percentiles. The bars in the boxes represent the medians. *p < 0.05 versus C rats; p < 0.05 versus NR.
Figure 5.
Figure 5.
Biochemical, neuroanatomical, and behavioral consequences of the social-defeat procedure. a, At D9, all defeated animals (n = 15) had high corticosterone concentrations, associated with higher adrenal gland weight than in control rats (animals not subjected to social defeat; n = 15). b, In all DF animals, serum BDNF concentrations were significantly lower than in C rats (n = 15). c, The social-defeat procedure induced a significant decrease in hippocampal BDNF concentration, as shown by comparison with C rats (n = 6). d, The decrease in hippocampal BDNF concentration was associated with decreases in hippocampal volume, neurogenesis, apical hippocampal CA3 dendrite length, and number of dendritic spines. Sholl analysis for C and DF animals is shown. Data presented as box plots show the 25th and 75th percentiles. The bars in the boxes represent the medians. *p < 0.05 versus C rats.
Figure 6.
Figure 6.
Identification of vulnerable and nonvulnerable animals. a, At D35, determination of corticosterone concentrations, adrenal gland weight, and serum BDNF concentrations in defeated rats (n = 37) and in control rats (animals not subjected to social defeat; n = 12). b, Negative correlation between serum BDNF concentrations at D35 and the corticosterone concentrations of SSP rats at D57 in same animals (n = 48). Inset, Cluster analysis. c, Based on the negative correlation, rats were separated in two categories: nonvulnerable (n = 28) with circulating BDNF concentrations similar as those obtained in control rats (n = 15), and vulnerable (n = 20) animals with lower serum BDNF concentrations. d, Longitudinal follow-up showed that the rats defined as NV or V animals at D35 became nondepressive (NR) and depressive (R), respectively, at the end of the SSP (D57). Data presented as box plots show the 25th and 75th percentiles. The bars in the boxes represent the medians. Circles represent atypical values. *p < 0.05 versus C rats; p < 0.05 versus NV.
Figure 7.
Figure 7.
Behavioral, biochemical, and neuroanatomical parameters in vulnerable and nonvulnerable animals. a, At D35, evaluation of depression-like profile (immobility time in the FST and sweet water consumption) in nonvulnerable (n = 10), vulnerable (n = 8), and control (n = 8–10) animals. b, Hippocampal BDNF concentrations in V, NV, and C animals (n = 5–10). c, Hippocampal volume, number of BrdU-positive hippocampal cells, apical CA3 hippocampal dendrites, and dendritic spines in V, NV, and C rats (n = 4–10). Sholl analysis in V, NV, and C animals is shown. Data presented as box plots show the 25th and 75th percentiles. The bars in the boxes represent the medians. *p < 0.05 versus C rats; p < 0.05 versus NV.
Figure 8.
Figure 8.
Chronic intracerebroventricular treatment with 7,8-DHF prevents biochemical, neuroanatomical, and behavioral parameters. a, 7,8-DHF was chronically delivered through ALZET minipumps from D35 until the end of the experiment (D57) in the brains of animals identified as nonvulnerable or vulnerable. In V rats, 7,8-DHF treatment reversed the decrease of hippocampal volume, neurogenesis, total apical dendrite lengths of CA3 hippocampal neurons, and spine density measured at the end of the treatment (D57; n = 4–7) compared to vehicle-treated V rats. Sholl analysis for vehicle-treated or 7,8-DHF-treated R, NR, and C animals is shown. b, At D57, the increase of corticosterone levels and adrenal gland weight as well as the decrease of sweet water consumption (anhedonia) and the enhancement of immobility time in FST observed in identified V animals treated with vehicle were completely prevented by chronic 7,8-DHF treatment (n = 8–13). *p < 0.05 versus NV rats receiving vehicle; p < 0.05 versus corresponding 7,8-DHF-treated groups; ap < 0.05 versus C rats receiving vehicle; b< versus corresponding 7,8-DHF-treated vulnerable rats.
Figure 9.
Figure 9.
Chronic treatment with imipramine reverses biochemical, neuroanatomical, and behavioral parameters. a, Imipramine (16 mg/kg/d) were delivered through ALZET osmotic minipumps, implanted subcutaneously on the backs of animals. Serum BDNF concentrations at D35 in imipramine-treated and vehicle-treated control rats, imipramine-defeated animals, and defeated rats receiving vehicle (nonvulnerable and vulnerable; n = 11–13) are shown. b, At D57, serum BDNF concentration, corticosterone levels, and adrenal gland weight in imipramine-treated and vehicle-treated control rats, imipramine-defeated animals, and defeated rats receiving vehicle (nonresponders and responders; n = 8–15). c, At D57, hippocampal BDNF concentrations, hippocampal volume, neurogenesis, total apical dendrite length of CA3 hippocampal neurons, spine density, Sholl analysis, and immobility time in the FST in defeated rats receiving vehicle (NR, R; n = 4–15). *p < 0.05 versus NV animals receiving vehicle; p < 0.05 versus DI; ap < 0.05 versus corresponding C groups.

Similar articles

Cited by

References

    1. Alleva E, Francia N. Psychiatric vulnerability: suggestions from animal models and role of neurotrophins. Neurosci Biobehav Rev. 2009;33:525–536. - PubMed
    1. Andre J, Zeau B, Pohl M, Cesselin F, Benoliel JJ, Becker C. Involvement of cholecystokininergic systems in anxiety-induced hyperalgesia in male rats: behavioral and biochemical studies. J Neurosci. 2005;25:7896–7904. - PMC - PubMed
    1. Becker C, Thiebot MH, Touitou Y, Hamon M, Cesselin F, Benoliel JJ. Enhanced cortical extracellular levels of cholecystokinin-like material in a model of anticipation of social defeat in the rat. J Neurosci. 2001;21:262–269. - PMC - PubMed
    1. Becker C, Zeau B, Rivat C, Blugeot A, Hamon M, Benoliel JJ. Repeated social defeat-induced depression-like behavioral and biological alterations in rats: involvement of cholecystokinin. Mol Psychiatry. 2008;13:1079–1092. - PubMed
    1. Bielajew C, Konkle AT, Merali Z. The effects of chronic mild stress on male Sprague-Dawley and Long Evans rats: I. Biochemical and physiological analyses. Behav Brain Res. 2002;136:583–592. - PubMed

Publication types

MeSH terms

LinkOut - more resources