. 2011 Sep 7;31(36):12906-15.
doi: 10.1523/JNEUROSCI.2091-11.2011.

Direct structural connections between voice- and face-recognition areas

Affiliations

Direct structural connections between voice- and face-recognition areas

Helen Blank et al. J Neurosci. .

Abstract

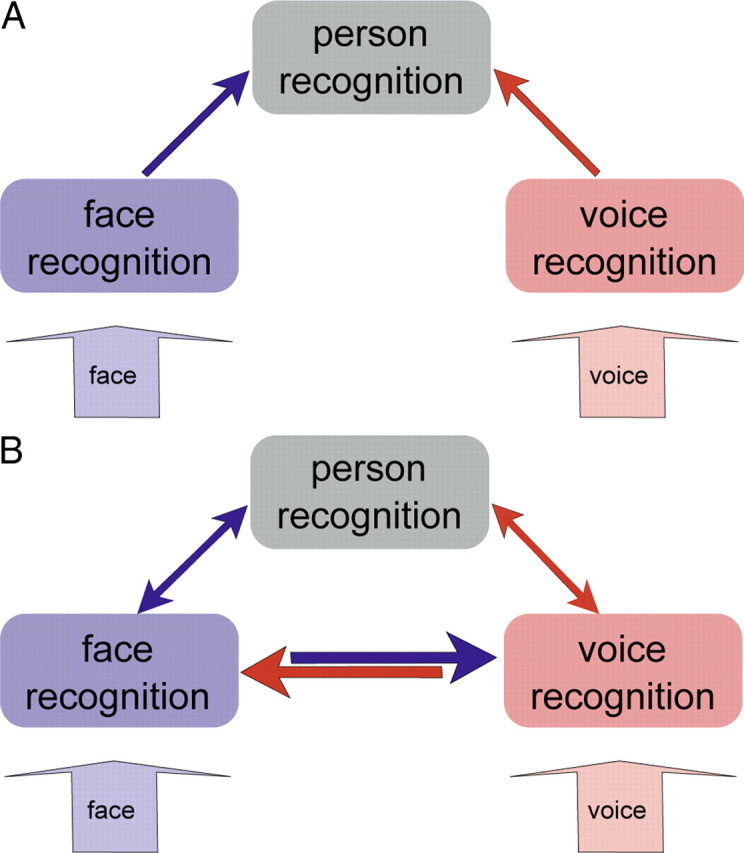
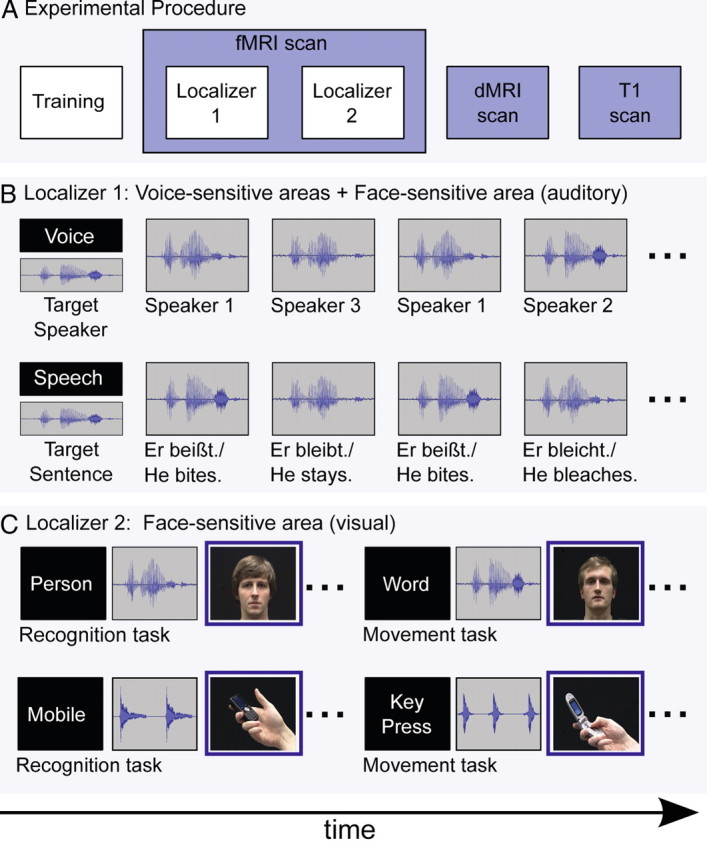
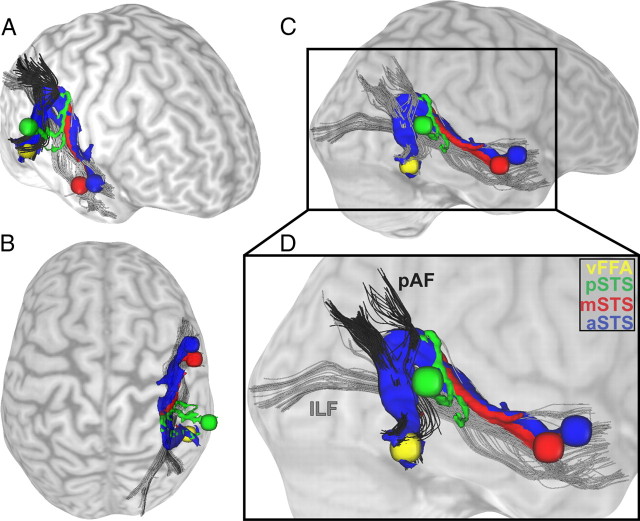
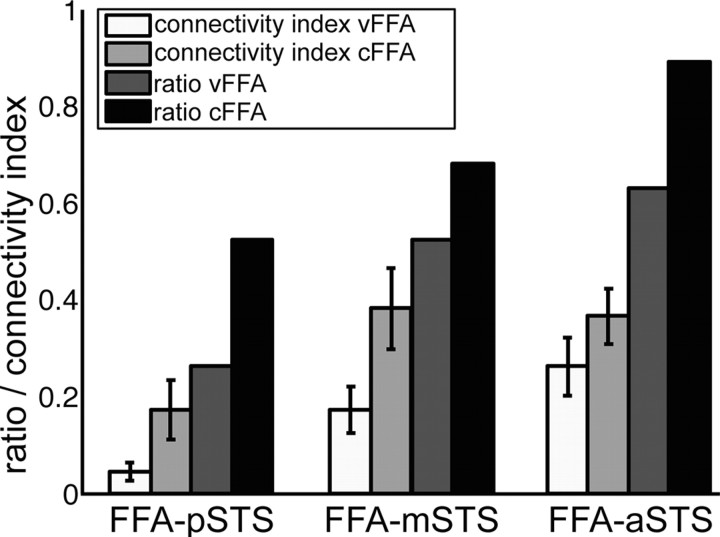
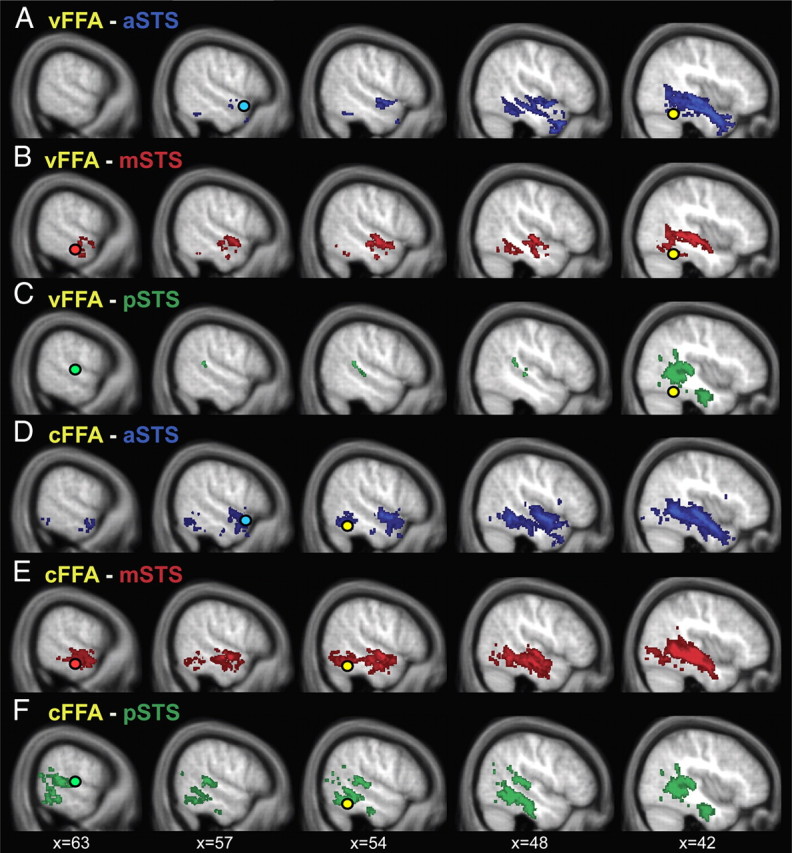
Currently, there are two opposing models for how voice and face information is integrated in the human brain to recognize person identity. The conventional model assumes that voice and face information is only combined at a supramodal stage (Bruce and Young, 1986; Burton et al., 1990; Ellis et al., 1997). An alternative model posits that areas encoding voice and face information also interact directly and that this direct interaction is behaviorally relevant for optimizing person recognition (von Kriegstein et al., 2005; von Kriegstein and Giraud, 2006). To disambiguate between the two different models, we tested for evidence of direct structural connections between voice- and face-processing cortical areas by combining functional and diffusion magnetic resonance imaging. We localized, at the individual subject level, three voice-sensitive areas in anterior, middle, and posterior superior temporal sulcus (STS) and face-sensitive areas in the fusiform gyrus [fusiform face area (FFA)]. Using probabilistic tractography, we show evidence that the FFA is structurally connected with voice-sensitive areas in STS. In particular, our results suggest that the FFA is more strongly connected to middle and anterior than to posterior areas of the voice-sensitive STS. This specific structural connectivity pattern indicates that direct links between face- and voice-recognition areas could be used to optimize human person recognition.


Conflict of interest statement

The authors declare no conflict of interest.

Figures

Figure 1.
Figure 1.
Two models for person recognition. A, Unisensory information is integrated at a supramodal stage of person recognition (Burton et al., 1990; Ellis et al., 1997). B, Unisensory information can also be integrated using direct reciprocal interactions between sensory areas (von Kriegstein et al., 2005; von Kriegstein and Giraud, 2006). Arrows indicate possible structural connections between areas.
Figure 2.
Figure 2.
Experimental procedure and design of the two functional localizers. A, Experimental procedure. All subjects participated in a training session before the two functional MRI localizer scans. In addition, we acquired, on a different day, a dMRI and a structural T1 scan. B, Localizer 1: block design to localize voice-sensitive areas in STS and responses to voices in the FFA. At the beginning of a block, subjects were instructed to perform a speech- or voice-recognition task on auditory sentences. Subjects decided for each sentence whether it was spoken by the target speaker (voice task) or whether the content of the sentence matched the target sentence (speech task). C, Localizer 2: event-related design to localize face-sensitive areas in fusiform gyrus (FFA). To localize the FFA, we used a contrast of visual faces > visual mobile phones. For details, see Material and Methods.
Figure 3.
Figure 3.
Structural connections between voice- and face-sensitive areas as found with probabilistic fiber tracking. Results of a single, representative participant's dMRI are shown as connectivity distribution. Probabilistic tractography was done in both directions: from the visual FFA as seed region to the three target regions in the STS and vice versa from the three seed regions in the STS to the FFA as target region. Seed and target regions were localized with a functional localizer and are displayed as spheres with a radius of 5 mm (yellow, FFA; blue, anterior part of the STS; red, middle part of the STS; green, posterior part of the STS). The structural connections between FFA and STS are colored correspondingly to their seed and target regions in the STS. The connections are displayed from different views: right frontal (A), top (B), and right side (C), plus a detailed view (D). As anatomical landmarks, the inferior longitudinal fasciculus (ILF) is shown in gray (B–D) and the posterior part of the arcuate fasciculus (pAF) is shown in black (C, D) (Catani et al., 2003, 2005; Catani and Thiebaut de Schotten, 2008). Close to the FFA, the connecting pathways follow the posterior part of the arcuate fasciculus before taking a turn to follow the inferior longitudinal fasciculus and reach the STS regions.
Figure 4.
Figure 4.
Quantitative analyses of structural connections between FFA and STS regions. Seed and target regions were the face-sensitive region (vFFA, cFFA) and the voice-sensitive regions (posterior, middle, and anterior STS). Structural connectivity indices (white and light gray) were calculated for each connection in individuals (n = 19 participants; error bars show SEM). Structural connectivity index was defined as the number of connected voxels divided by the overall number of connected voxels per participant and by the number of voxels of seed and target regions (Eickhoff et al., 2010). The structural connectivity index was multiplied by 100 for a common display together with ratio values: The ratio (dark gray) shows the number of subjects who showed a connection normalized by the number of all participants (n = 19).
Figure 5.
Figure 5.
Group overlay of probabilistic pathways between voice-sensitive STS and face-sensitive FFA. Connectivity distributions of 19 participants' dMRI data were binarized, thresholded at 10 paths per voxel at the individual subject level, and overlaid for display purposes. There are connections between the FFA (yellow circle) and the anterior part of the STS (blue circle; A, D), the middle part of the STS (red circle; B, E), and the posterior part of the STS (green circle, C, F). The connectivity distributions are colored correspondingly to the STS seed and target masks. A–C, Tracking results for FFA localized with the visual localizer. D–F, FFA localized with the auditory localizer. Tracking results are depicted on the averaged T1 scan of the 19 subjects.

Similar articles

Cited by

References

    1. Andics A, McQueen JM, Petersson KM, Gál V, Rudas G, Vidnyánszky Z. Neural mechanisms for voice recognition. Neuroimage. 2010;52:1528–1540. - PubMed
    1. Anwander A, Tittgemeyer M, von Cramon DY, Friederici AD, Knösche TR. Connectivity-based parcellation of Broca's area. Cereb Cortex. 2007;17:816–825. - PubMed
    1. Arnal LH, Morillon B, Kell CA, Giraud AL. Dual neural routing of visual facilitation in speech processing. J Neurosci. 2009;29:13445–13453. - PMC - PubMed
    1. Basser PJ, Pierpaoli C. Microstructural and physiological features of tissues elucidated by quantitative-diffusion-tensor MRI. J Magn Reson B. 1996;111:209–219. - PubMed
    1. Basser PJ, Mattiello J, LeBihan D. Estimation of the effective self-diffusion tensor from the NMR spin-echo. J Magn Reson B. 1994;103:247–254. - PubMed

Publication types

MeSH terms

LinkOut - more resources