. 2011 Sep 7;31(36):12916-26.
doi: 10.1523/JNEUROSCI.2205-11.2011.

Upregulation of KCC2 activity by zinc-mediated neurotransmission via the mZnR/GPR39 receptor

Affiliations

Upregulation of KCC2 activity by zinc-mediated neurotransmission via the mZnR/GPR39 receptor

Ehud Chorin et al. J Neurosci. .

Abstract

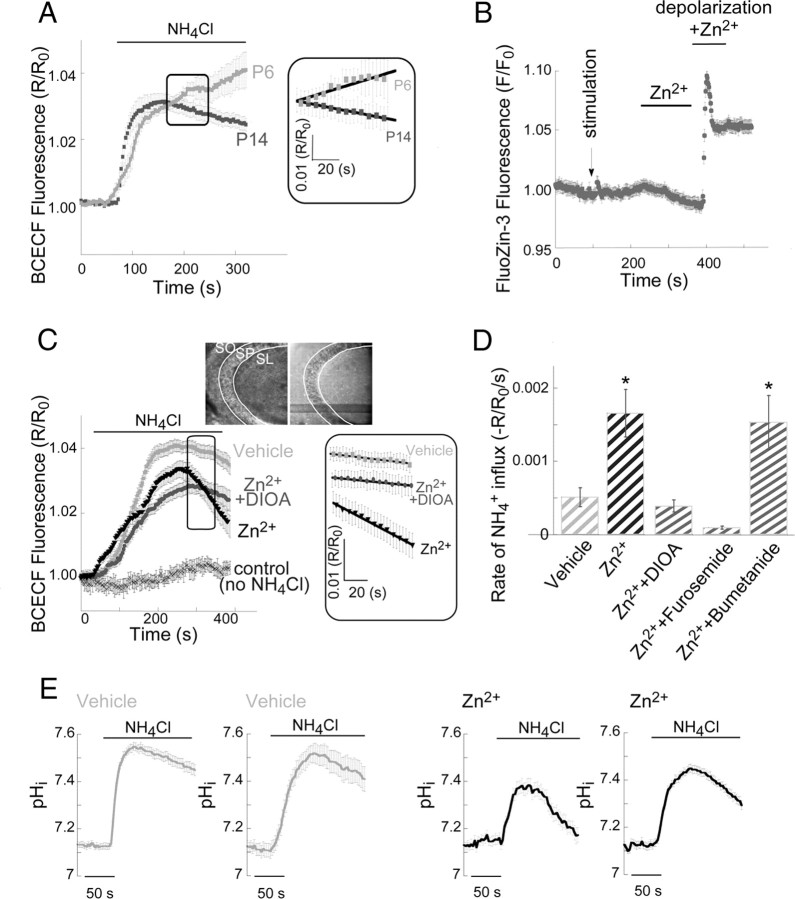
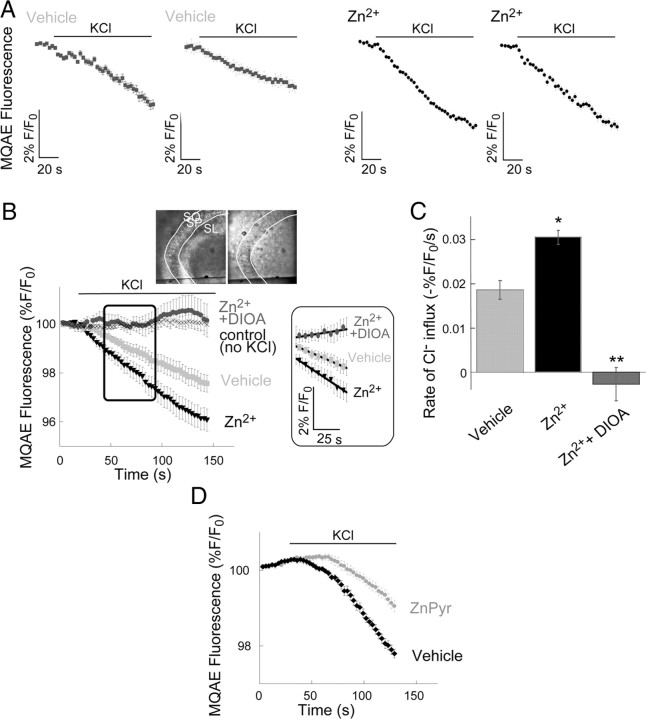
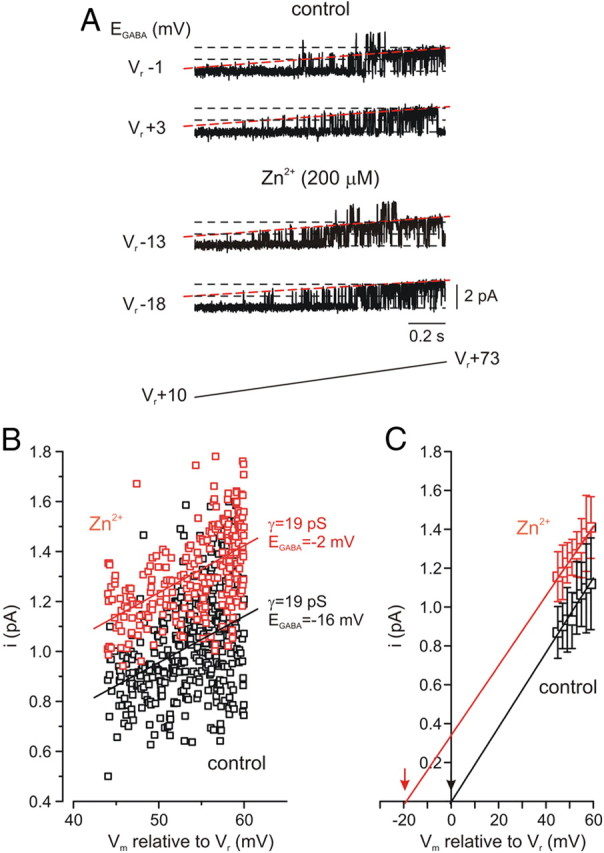
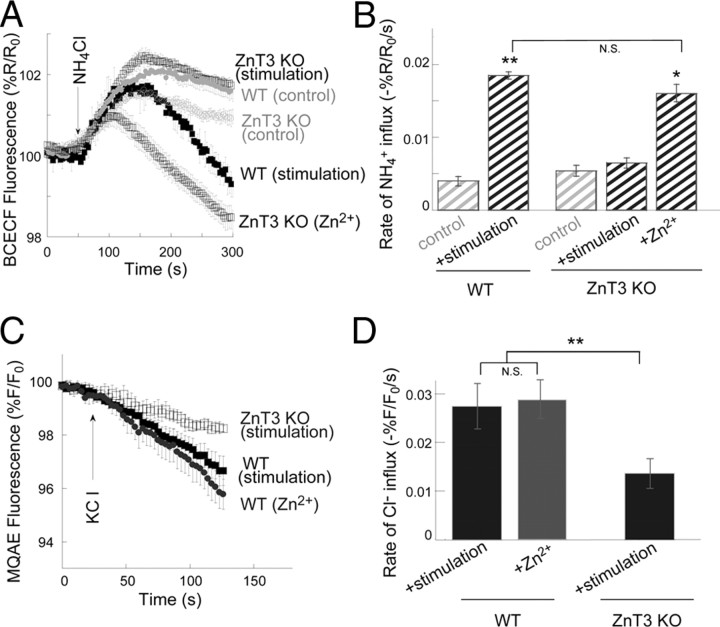
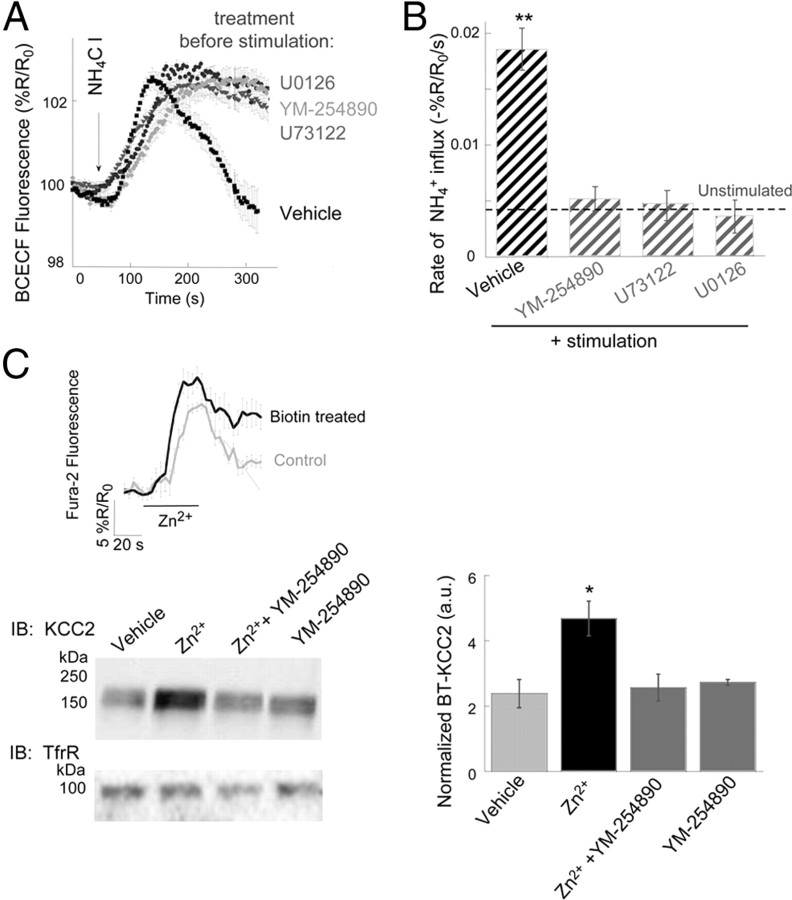
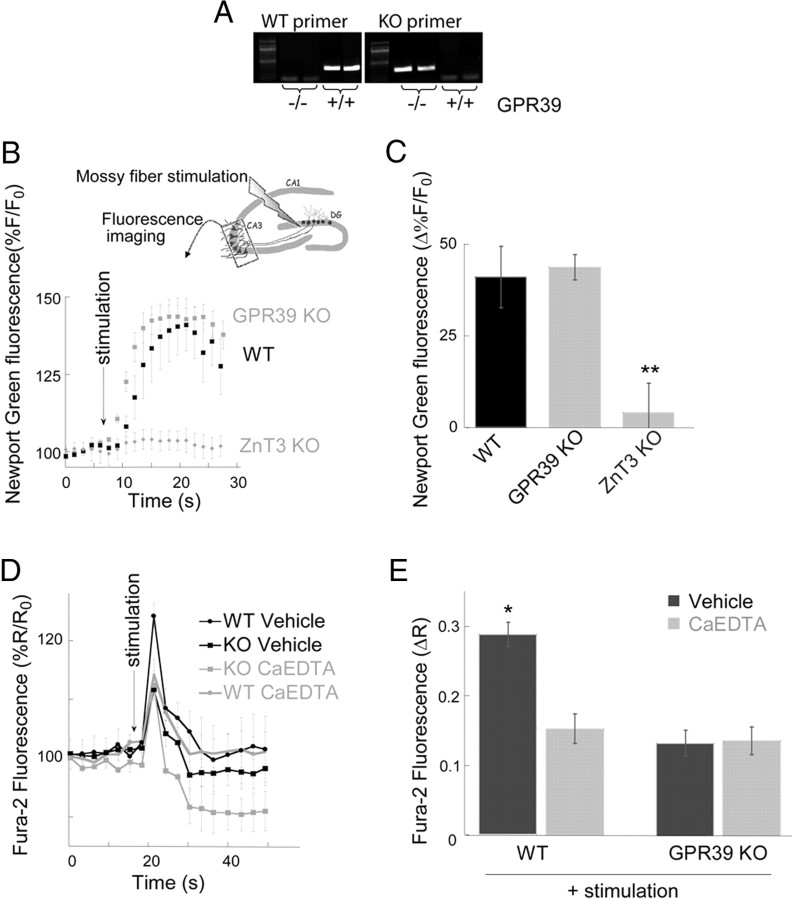
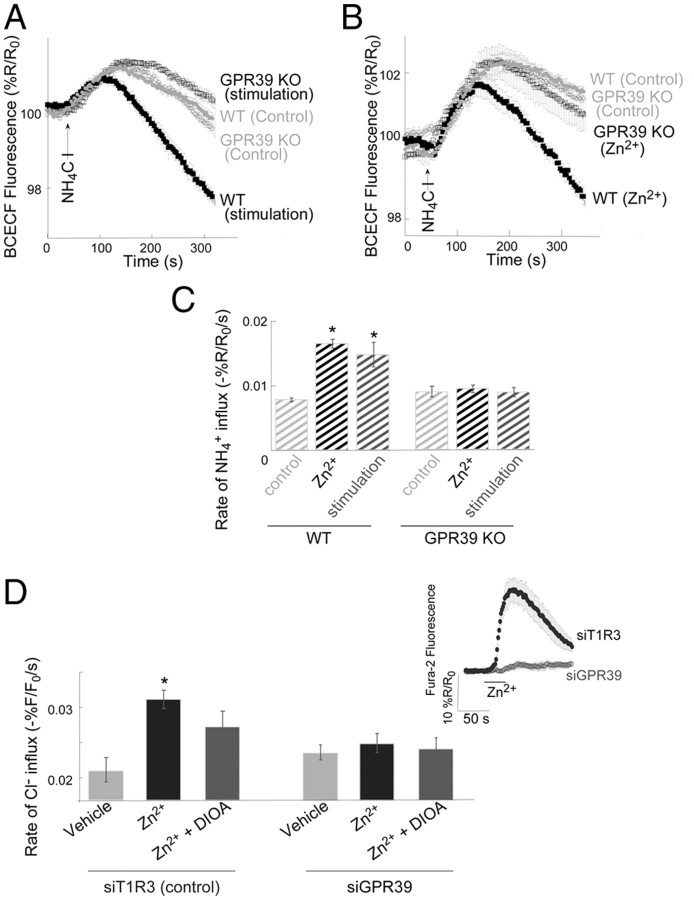
Vesicular Zn(2+) regulates postsynaptic neuronal excitability upon its corelease with glutamate. We previously demonstrated that synaptic Zn(2+) acts via a distinct metabotropic zinc-sensing receptor (mZnR) in neurons to trigger Ca(2+) responses in the hippocampus. Here, we show that physiological activation of mZnR signaling induces enhanced K(+)/Cl(-) cotransporter 2 (KCC2) activity and surface expression. As KCC2 is the major Cl(-) outward transporter in neurons, Zn(2+) also triggers a pronounced hyperpolarizing shift in the GABA(A) reversal potential. Mossy fiber stimulation-dependent upregulation of KCC2 activity is eliminated in slices from Zn(2+) transporter 3-deficient animals, which lack synaptic Zn(2+). Importantly, activity-dependent ZnR signaling and subsequent enhancement of KCC2 activity are also absent in slices from mice lacking the G-protein-coupled receptor GPR39, identifying this protein as the functional neuronal mZnR. Our work elucidates a fundamentally important role for synaptically released Zn(2+) acting as a neurotransmitter signal via activation of a mZnR to increase Cl(-) transport, thereby enhancing inhibitory tone in postsynaptic cells.


Figures

Figure 1.
Figure 1.
Extracellular Zn2+ upregulates NH4+-dependent influx mediated by KCC2 activity. A, To assess KCC2 transport activity, we monitored BCECF fluorescence in acute mouse hippocampal slices using the NH4+ transport paradigm. Application of NH4Cl (5 mm) induces initial alkalinization (due to passive diffusion of NH3 through the cell membrane). Subsequent NH4+ influx via KCC2, acting in reverse mode, induces acidification of the cells, and the initial rate of acidification represents KCC2 activity (see Materials and Methods). This paradigm was applied to slices obtained from 6- or 14-d-old mice (n = 4 slices). Inset shows the signal in the region marked by the box, where the linear regression curve was fitted to represent KCC2 activity. Note that for clarity of the inset only every second measurement is shown. Averaged rates of NH4+ influx were 0.0006 ± 0.0004 (R/R0/s) in P6 slices and −0.0004 ± 0.0003 (R/R0/s) in P14 slices (*p < 0.05). B, Intracellular Zn2+ concentration in slices loaded with FluoZin-3, following (at indicated times) electrical stimulation (Besser et al., 2009), addition of Zn2+ (200 μm) and depolarization using ACSF containing 50 mm KCl (replacing NaCl) in the presence of Zn2+ (200 μm). Only following depolarization, in the presence of Zn2+, a rise in fluorescence was observed (n = 3 slices). C, Averaged traces from BCECF-loaded slices (n = 8 slices), imaged with or without application of NH4Cl (5 mm) in the presence or absence of DIOA (100 μm). Slices were pretreated with extracellular Zn2+ (200 μm, 2 min) or maintained in ACSF (vehicle) and imaged within 2 min. In the box, the signal from the region marked in the graph is depicted, and the linear regression curve that was fitted to represent KCC2 activity is shown. Note that for clarity only every second measurement is shown. Inset shows bright-field (left) and BCECF fluorescence (right) images of the CA3 region that was monitored; SO stratum oriens, SL stratum lucidum. D, Averaged rate of acidification due to steady-state NH4+ influx ±SEM (n = 8 slices, *p < 0.05 compared with vehicle control). The rate of NH4+ influx is enhanced following pretreatment with extracellular Zn2+, and is blocked by DIOA (100 μm) or furosemide (100 μm) but not by the Na+/K+/Cl cotransporter inhibitor bumetanide (1 μm). E, Shown are representative traces from slices exposed to NH4Cl that were calibrated to pHi, using the calibration curve (see Materials and Methods). Each trace is an average of 7–12 ROIs within the somatic CA3 region from a single slice. Slices were treated with Zn2+ (200 μm, 2 min) or maintained in ACSF (vehicle) as marked.
Figure 2.
Figure 2.
Extracellular Zn2+ upregulates Cl-dependent influx mediated by KCC2 activity. A, Representative traces from slices loaded with the Cl-sensitive dye MQAE (Hershfinkel et al., 2009), each trace is an average of 7–12 ROIs within the somatic CA3 region of one slice. Slices were treated with Zn2+ (200 μm, 2 min) or maintained in ACSF (vehicle). Within 2 min of the Zn2+ treatment slices were imaged and 10 mm KCl was added as indicated. B, Averaged traces from slices treated with or without 10 mm KCl. Shown are traces from control slices (vehicle, n = 7 slices), slices pretreated with extracellular Zn2+ (200 μm, 2 min, n = 7 slices), slices treated with Zn2+ in the presence of the KCC2 inhibitor DIOA (100 μm, n = 10 slices) or control slices, without KCl (n = 9 slices). Inset shows the CA3 region that was imaged (left, bright-field; right, fluorescent images); SO stratum oriens, SL stratum lucidum. In the box, the signal from the region marked in the graph is depicted, and the linear regression curve that was fitted to represent KCC2 activity is shown. Note that for clarity every second measurement is shown. C, Averaged rates ± SEM (n = 7 slices for vehicle or Zn2+-treated, and 10 slices for Zn2+ + DIOA) of Cl influx as monitored in B (*p < 0.05, **p < 0.01 compared with vehicle control). D, The effect of intracellular Zn2+ rise on KCC2 activity was determined in MQAE-loaded slices, as in A. Shown are averaged traces from control slices (vehicle) or slices pretreated with Zn2+ (100 μm) in the presence of its ionophore pyrithione (5 μm), marked as ZnPyr (n = 5 slices). Averaged rates of Cl influx were 0.033 ± 0.004 (−%F/F0/s) in vehicle control slices and 0.017 ± 0.002 (−%F/F0/s) in the ZnPyR-treated slices (*p < 0.05).
Figure 3.
Figure 3.
Extracellular Zn2+ induces a hyperpolarizing shift in GABAA reversal potential. A, In cell-attached recordings with 5 μm GABA in a patch pipette, GABAA channel reversal potential was measured by delivering slow depolarizing voltage ramps from 10 to 73 mV relative to the membrane resting potential (Vr +10 to Vr +73 mV) every 15 s (n = 4 cells). Shown are two consecutive ramp current sweeps from a patch which contained GABAA channels, under control conditions (top) and the same patch 5 min after addition of Zn2+ (200 μm, 2 min) to the bath (bottom), with the respective extrapolated EGABA values for each ramp to the left. Sweeps are leak-subtracted and digitized at 20 kHz through a low-pass filter of 2 kHz (−3 dB). Dashed lines (red) are drawn through the closed and single-channel open state. B, Effect of Zn2+ application on I–V relationships of the current through a single GABAA channel-containing patch. Amplitudes of channel opening plotted against voltage in control (vehicle treated, black) and following Zn2+ application (red), from a representative cell. The straight lines are linear fits of the data. Notice that the channel slope conductance remains unchanged (19 pS), the extrapolated EGABA, however, shifted from the membrane resting potential from −2 to −16 mV following Zn2+ application. C, Mean unitary current amplitudes binned with a step of 2 mV and averaged over all patches. Note that the x-axis intercepts of the two fitted lines (indicated by arrows) give the reversal potential values of Vr −2.3 ± 0.5 mV in control and Vr −17 ± 2 mV following Zn2+ application.
Figure 4.
Figure 4.
KCC2 activity is upregulated by synaptic Zn2+ released from mossy fibers. A, KCC2 activity measured in BCECF-loaded slices, as in Figure 1. Slices from ZnT3 KO mice lacking synaptic Zn2+ (open symbols) or WT mice (filled symbols) were monitored under control nonstimulated conditions or 2 min following electrical stimulation of the mossy fibers (a train of 10 pulses at 66 Hz) that induces release of synaptic Zn2+ (n = 6), or following application of Zn2+ (200 μm, 2 min, n = 6 slices). B, Averaged rates of NH4+ influx ± SEM as monitored in A (n = 6 slices, **p < 0.01 compared with WT control). C, KCC2-dependent Cl transport monitored in MQAE-loaded slices, as in Figure 2, using 10 mm KCl to reverse KCC2 activity. Slices from ZnT3 KO mice (open symbols) or WT mice (filled symbols) were monitored following stimulation of the mossy fibers (a train of 10 pulses at 66 Hz) or following application of Zn2+ (200 μm, 2 min) (n = 5 slices). D, Averaged rates ± SEM of Cl influx as monitored in C (n = 5 slices, **p < 0.01 compared with the stimulated ZnT3 KO). The rate of ion influx, using the NH4+ or Cl transport, is enhanced following mossy fiber stimulation in slices from WT mice compared with ZnT3 KO mice, indicating that KCC2 activity is upregulated by the release of synaptic Zn2+.
Figure 5.
Figure 5.
Upregulation of KCC2 activity is mediated by mZnR signaling pathway and enhanced KCC2 surface expression. A, KCC2 activity was monitored in slices from WT mice loaded with BCECF, following stimulation of the mossy fibers in control slices (vehicle) or in slices pretreated with a Gαq inhibitor (YM-254890, 1 μm), a PLC inhibitor (U73122, 1 μm) or an ERK1/2 inhibitor (U0126, 1 μm); n = 7 slices. B, Averaged rate of NH4+ influx as monitored in A. Dashed line indicates the rate of transport in nonstimulated control slices taken from Figure 4A (n = 7 slices, **p < 0.01 compared with vehicle control without stimulation). C, Top, Slices were biotinylated, control slices were maintained in ACSF, and loaded with the intracellular Ca2+-sensitive dye, Fura-2. Then Zn2+ (200 μm) was applied and the Ca2+ response is shown in control and biotinylated slices. Bottom, Surface expression level of KCC2, monitored using surface biotinylation followed by immunoblotting of KCC2 or transferrin receptor (TrfR), which is a nonrelated membrane transporter used as control. Surface expression in vehicle-control slices or in slices treated with Zn2+ in the presence or absence of YM-254890 (1 μm). Densitometry analysis of KCC2 surface expression is shown to the right, normalized to TrfR expression (n = 4 slices, *p < 0.05 compared with vehicle control).
Figure 6.
Figure 6.
GPR39 mediates mZnR-dependent Ca2+ response in CA3 hippocampal neurons. A, Analysis of GPR39 transcripts was determined using PCR. The WT allele gives a 311 bp and the targeted GPR39 KO allele gives a 262 bp PCR product. This identifies GPR39−/− (KO) or GPR39+/+ (WT) mice. B, Synaptic Zn2+ release was determined using the nonpermeant form of Newport Green (Frederickson et al., 2006). Extracellular Zn2+-dependent changes in Newport Green (2 μm) fluorescence were monitored in the CA3 region following stimulation of the mossy fibers in slices from WT mice, GPR39 KO mice or ZnT3 KO mice, lacking synaptic Zn2+. Inset is a schematic model of the experimental setup. C, Averaged stimulation-dependent rise of Newport Green fluorescence, normalized to the initial fluorescence, monitored in slices from WT, GPR39 KO mice (n = 6 slices) or ZnT3 KO mice (n = 4 slices, **p < 0.01 compared with the GPR39 WT). D, Slices from WT or GPR39 KO mice were loaded with Fura-2, an intracellular Ca2+-sensitive dye. Intracellular Ca2+ rise was monitored following stimulation of the mossy fibers (a train of 10 pulses at 66 Hz, at the indicated time) in the presence of ACSF solution (vehicle) or ACSF containing the extracellular Zn2+ chelator CaEDTA (100 μm) (n = 7 slices). E, Averaged change of Ca2+ rises as monitored in D (n = 7 slices, **p < 0.01 compared with stimulated WT in ACSF). Note that the residual Ca2+ response in the slices from GPR39 KO mice is not attenuated further by CaEDTA and is similar to the response observed in the presence of CaEDTA in slices from WT mice.
Figure 7.
Figure 7.
GPR39 mediates Zn2+-dependent upregulation of KCC2 activity. A, KCC2 activity was studied using the BCECF paradigm. NH4+ influx rate was monitored in slices from WT (filled symbols) or GPR39 KO (open symbols) mice loaded with BCECF. BCECF fluorescence changes were monitored in slices following mossy fiber stimulation (a train of 10 pulses at 66 Hz) or in control nonstimulated slices (n = 6 slices). B, Slices from WT (filled symbols) or GPR39 KO (open symbols) mice (as in A) were pretreated with extracellular Zn2+ (200 μm, 2 min) or controls (n = 6 slices) and NH4+ influx rate was monitored. C, Averaged rates of NH4+ influx as monitored in A-B (n = 6 slices, *p < 0.05 compared with WT control). In slices from GPR39 KO mice, application of exogenous Zn2+ or synaptic Zn2+ release by mossy fiber stimulation did not affect KCC2 activity, which was similar to the level of the transporter activity in control slices obtained from WT mice. D, SHSY-5Y cells were transfected with siRNA constructs for silencing GPR39 (Besser et al., 2009) or a nonrelated G-protein-coupled receptor (siT1R3, control) and subjected to the MQAE paradigm to monitor KCC2 activity. Cells were treated with or without Zn2+ (200 μm, 2 min) and KCC2 activity was monitored in the presence or absence of DIOA (n = 5, *p < 0.05 compared with vehicle siT1R3, control). Zn2+-dependent Ca2+ rise was monitored using Fura-2 (see inset) and was attenuated in the siGPR39 transfected cells.

References

    1. Aizenman E, Stout AK, Hartnett KA, Dineley KE, McLaughlin B, Reynolds IJ. Induction of neuronal apoptosis by thiol oxidation: putative role of intracellular zinc release. J Neurochem. 2000;75:1878–1888. - PubMed
    1. Amaral DG, Witter MP. The three-dimensional organization of the hippocampal formation: a review of anatomical data. Neuroscience. 1989;31:571–591. - PubMed
    1. Amaral DG, Scharfman HE, Lavenex P. The dentate gyrus: fundamental neuroanatomical organization (dentate gyrus for dummies) Prog Brain Res. 2007;163:3–22. - PMC - PubMed
    1. Banke TG, Gegelashvili G. Tonic activation of group I mGluRs modulates inhibitory synaptic strength by regulating KCC2 activity. J Physiol. 2008;586:4925–4934. - PMC - PubMed
    1. Beierlein M, Fall CP, Rinzel J, Yuste R. Thalamocortical bursts trigger recurrent activity in neocortical networks: layer 4 as a frequency-dependent gate. J Neurosci. 2002;22:9885–9894. - PMC - PubMed

Publication types

MeSH terms