. 2011 Sep 7;31(36):12982-91.
doi: 10.1523/JNEUROSCI.3093-11.2011.

Mitochondrial Ca(2+) uptake is essential for synaptic plasticity in pain

Affiliations

Mitochondrial Ca(2+) uptake is essential for synaptic plasticity in pain

Hee Young Kim et al. J Neurosci. .

Abstract

The increase of cytosolic free Ca(2+) ([Ca(2+)](c)) due to NMDA receptor activation is a key step for spinal cord synaptic plasticity by altering cellular signal transduction pathways. We focus on this plasticity as a cause of persistent pain. To provide a mechanism for these classic findings, we report that [Ca(2+)](c) does not trigger synaptic plasticity directly but must first enter into mitochondria. Interfering with mitochondrial Ca(2+) uptake during a [Ca(2+)](c) increase blocks induction of behavioral hyperalgesia and accompanying downstream cell signaling, with reduction of spinal long-term potentiation (LTP). Furthermore, reducing the accompanying mitochondrial superoxide levels lessens hyperalgesia and LTP induction. These results indicate that [Ca(2+)](c) requires downstream mitochondrial Ca(2+) uptake with consequent production of reactive oxygen species (ROS) for synaptic plasticity underlying chronic pain. These results suggest modifying mitochondrial Ca(2+) uptake and thus ROS as a type of chronic pain therapy that should also have broader biologic significance.


Figures

Figure 1.
Figure 1.
Effects of mitochondrial Ca2+ uptake inhibition on NMDA- and capsaicin-induced pain behaviors (a–d) and mitochondrial Ca2+ levels (e–k). Intrathecal injection of Ru360, RuR, or FCCP/oligomycin (Oli) reduced intrathecal NMDA- or intradermal capsaicin (Cap)-induced mechanical hyperalgesia when pretreated (a, c, d) but not post-treated (b). The effect of Ru360 was dose dependent (a). *p < 0.05 vs vehicle in a–d. f–i, Representative mitochondrial Ca2+ images in the spinal deep dorsal horn (laminae IV–V) visualized by Rhod2/AM (33 μm,10 μl, i.t. injection). [Ca2+]m levels were quantified from both superficial (laminae I–II) and deep (laminae IV–V) dorsal horns indicated by red rectangles in the schematic drawing (e). [Ca2+]m levels were increased significantly after NMDA (55 μm, 5 μl, i.t.), and this increase was blocked by pretreatment (h) but not post-treatment (i) with Ru360 (50 μm). Scale bar, 20 μm. j, k, The average of total Rhod2/AM-positive profile areas in the superficial (I–II; j) and deep (IV–V; k) dorsal horn (5 mice per group). p < 0.05 vs Vehicle, *p < 0.05 vs NMDA in j, k.
Figure 2.
Figure 2.
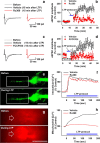
Inhibition of mitochondrial Ca2+ uptake blocked spinal LTP while permitting a cytosolic Ca2+ increase. a–d, Effect of mitochondrial Ca2+ uptake inhibition on NMDA-induced spinal LTP. Examples of evoked EPSC (eEPSC) tracings (a, c) and summary data of eEPSC amplitudes (b, d) before and after application of a LTP protocol (blue bar; a perfusion of NMDA/glycine with depolarization for 5 min) with and without mitochondrial inhibition by inclusion of Ru360 (25 μm) in the patch pipette (a, b) or preincubation with FCCP (1 μm)/oligomycin (Oli, 20 μm) (c, d) (n = 7–8 per group). Both manipulations blocked the NMDA-induced LTP induction. e, Confocal images of cytosolic Ca2+ in the dorsal horn neuron before and 150 s after the initiation of an LTP protocol using Oregon Green BAPTA-1 injected into the neuron through a patch pipette. f, Summary of results of such experiments measured from dendrites (one example is shown as white squares in e) with or without Ru360. Ru360 did not decrease cytosolic Ca2+ levels during LTP induction compared with the vehicle. g, Epifluorescence images of mitochondrial Ca2+ by Rhod2/AM in a dorsal horn neuron soma (indicated by arrows) before and 150 s after the initiation of the LTP induction without Ru360. h, Summary of mitochondrial Ca2+ changes in the soma during LTP induction with or without Ru360. Ru360 blocked the increase of [Ca2+]m during LTP protocol. Scale bar, 20 μm. Each trace shown in f and h is the average of 6 and 8 cells per group, respectively.
Figure 3.
Figure 3.
Effects of mitochondrial ROS reductions either by an ETC I inhibitor, rotenone, or a ROS scavenger, PBN, on NMDA- or capsaicin-induced hyperalgesia (a–d) and mitochondria superoxide levels (e–j). a–d, Rotenone and PBN were injected 30 min and 10 min before NMDA injection, respectively. Both rotenone (20 and 50 but not 10 μm, i.t.) and PBN (50 mg/kg, i.p.) significantly reduced NMDA (a, b)- or capsaicin (c, d)-induced hyperalgesia. *p < 0.05 vs vehicle in a–d. e–h, Images of mitochondrial superoxide (visualized by MitoSox Red) in the spinal dorsal horn (lamina IV) (scale bar, 20 μm) and the average mitochondrial superoxide levels in the superficial (I–II; i) and deep (IV–V; j) dorsal horn. The superoxide levels were quantified 30 min after intrathecal NMDA injection. p < 0.05 vs Vehicle, *p < 0.05 vs NMDA in i, j.
Figure 4.
Figure 4.
Effects of a superoxide scavenger, TEMPOL, on spinal LTP. Examples of eEPSC tracings before and after LTP induction with or without TEMPOL are shown in a. TEMPOL superfusion (1 mm, 10 min; red bar), which blocked induction of spinal LTP by a LTP protocol (blue bar), is shown in b (n = 8 per group).
Figure 5.
Figure 5.
The effect of mitochondrial Ca2+ uptake inhibition on intrathecal NMDA-induced protein kinase C activation. a–l, Images of the spinal dorsal horn (laminae I–II) immunostained for phosphorylated PKCα (pPKCα Ser-657) in 4 groups of mice: normal (a–c), with intrathecal NMDA (d–f), with intrathecal NMDA + Ru360 (g–i), and with intrathecal NMDA + FCCP/oligomycin (Oli) (j–l). Intense pPKCα staining (red circles) in neurons (identified by NeuN immunoreactivity, green) in the NMDA group (d–f) indicates the PKC translocation/activation by NMDA receptor activation. The PKC translocation was prevented by pretreatment with Ru360 (g–i) or FCCP/oligomycin.(j–l). m, n, Percentages of neurons that displayed pPKCα immunoreactivity, presumably translocation to the plasma membrane, in the superficial (I–II; m) and deep dorsal horn (IV–V; n). p < 0.05 vs Vehicle, *p < 0.05 vs NMDA. The data from 5–7 animals 30 min after NMDA treatment were averaged for each group. o–t, Examples of superficial dorsal horn (laminae I–II) double immunostained for pPKCα (red; o, r) and for either an astrocyte marker, GFAP (green, p) or a microglial marker, OX-42 (green, s), in intrathecal NMDA-treated mice. pPKCα-positive staining was not colocalized with either astrocytic or microglial staining (q, t), thus indicating that PKCα activation is primarily in neurons. Scale bar, 20 μm.
Figure 6.
Figure 6.
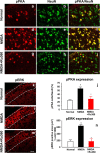
The effect of mitochondrial Ca2+ uptake inhibition on intrathecal NMDA-induced PKA or ERK activation in spinal dorsal horn neurons. a–i, Images of superficial dorsal horn (laminae I–II) immunostained for pPKA in 3 groups of mice: normal (a–c), with intrathecal NMDA (d–f), and with intrathecal NMDA + Ru360 (g–i). Double-labeled cells with pPKA (red) and NeuN (green; neuronal marker) appear in yellow in merged panels (c, f, i). j, The averaged percentages of pPKA-positive neurons (I–II). k–m, Images of superficial dorsal horn immunostained for pERK in normal (k), intrathecal NMDA (l)-treated, and intrathecal NMDA + Ru360 (m)-treated mice. The areas showing immunopositivity to pERK were quantified by densitometry in laminae I–II (within the dashed line area), and the data are shown in the graph in n. Both PKA and ERK were activated by intrathecal NMDA, but this activation was significantly reduced by blocking mitochondrial Ca2+ uptake. p < 0.05 vs Vehicle, *p < 0.05 vs NMDA. The data from 5–7 animals were averaged for each group. Scale bar, 20 μm.
Figure 7.
Figure 7.
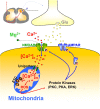
A diagrammatic representation of the proposed hypothesis that mitochondrial Ca2+ uptake is an essential downstream event of [Ca2+]c influx for synaptic plasticity in the spinal cord. During NMDA receptor activation, there is a massive Ca2+ influx into spinal dorsal horn neurons. Most of the Ca2+ is rapidly sequestrated by mitochondria. This consequently increases ROS production, which leads to activation of intracellular signaling cascades (i.e., PKC, PKA, and ERK), which in turn results in synaptic plasticity of the dorsal horn neurons. Glu, glutamate; AMPAR, AMPA receptor; circled P, phosphorylation.

Similar articles

Cited by

References

    1. Billups B, Forsythe ID. Presynaptic mitochondrial calcium sequestration influences transmission at mammalian central synapses. J Neurosci. 2002;22:5840–5847. - PMC - PubMed
    1. Brookes PS, Yoon Y, Robotham JL, Anders MW, Sheu SS. Calcium, ATP, and ROS: a mitochondrial love-hate triangle. Am J Physiol Cell Physiol. 2004;287:C817–C833. - PubMed
    1. Coderre TJ. Contribution of protein kinase C to central sensitization and persistent pain following tissue injury. Neurosci Lett. 1992;140:181–184. - PubMed
    1. Coderre TJ, Melzack R. The role of NMDA receptor-operated calcium channels in persistent nociception after formalin-induced tissue injury. J Neurosci. 1992;12:3671–3675. - PMC - PubMed
    1. Cox B. Calcium channel blockers and pain therapy. Curr Rev Pain. 2000;4:488–498. - PubMed

Publication types

MeSH terms