. 2012 Feb;29(2):689-705.
doi: 10.1093/molbev/msr222. Epub 2011 Sep 7.

Evolution at the subgene level: domain rearrangements in the Drosophila phylogeny

Affiliations

Evolution at the subgene level: domain rearrangements in the Drosophila phylogeny

Yi-Chieh Wu et al. Mol Biol Evol. 2012 Feb.

Abstract

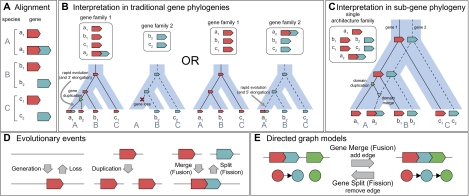
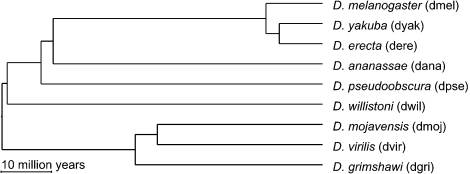
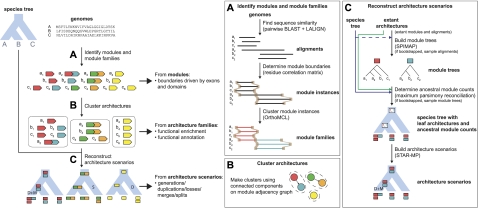
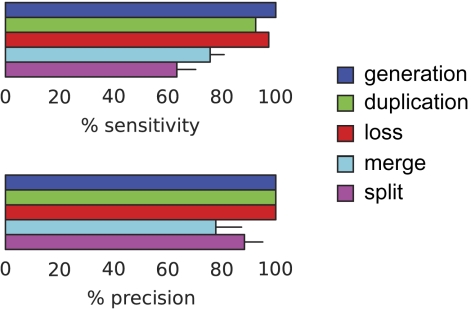
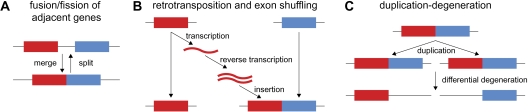
Although the possibility of gene evolution by domain rearrangements has long been appreciated, current methods for reconstructing and systematically analyzing gene family evolution are limited to events such as duplication, loss, and sometimes, horizontal transfer. However, within the Drosophila clade, we find domain rearrangements occur in 35.9% of gene families, and thus, any comprehensive study of gene evolution in these species will need to account for such events. Here, we present a new computational model and algorithm for reconstructing gene evolution at the domain level. We develop a method for detecting homologous domains between genes and present a phylogenetic algorithm for reconstructing maximum parsimony evolutionary histories that include domain generation, duplication, loss, merge (fusion), and split (fission) events. Using this method, we find that genes involved in fusion and fission are enriched in signaling and development, suggesting that domain rearrangements and reuse may be crucial in these processes. We also find that fusion is more abundant than fission, and that fusion and fission events occur predominantly alongside duplication, with 92.5% and 34.3% of fusion and fission events retaining ancestral architectures in the duplicated copies. We provide a catalog of ∼9,000 genes that undergo domain rearrangement across nine sequenced species, along with possible mechanisms for their formation. These results dramatically expand on evolution at the subgene level and offer several insights into how new genes and functions arise between species.


Figures

F<sc>IG</sc>. 1.
FIG. 1.
Relationship between species trees, gene trees, and architecture scenarios. (A) Gene sequences are compared across species, and a multiple sequence alignment is constructed. Due to the presence of domains or complicated evolutionary mechanisms, these alignments may have a block structure indicating similarity at the subgene level. (B) In conventional phylogenetics, genes that descend from a single common ancestor are clustered into a gene family, and the history of gene families are viewed through gene trees (black lines) that evolve inside a species tree (blue area). Duplication (☆), loss (×), and speciation (colored subgene blocks) events are inferred through the reconcilation of gene trees to species trees. Since each gene can belong to only a single gene family, joint histories that are evident from the architecture structure cannot be captured. (C) In subgene phylogenetics as presented in this work, a gene family is generalized to an architecture family in order to capture the relationships between genes with shared modules. This allows the reconstruction of gene histories to be architecture aware, with an architecture scenario depicting more complicated events such as merges (triangledown) and splits (not shown). By definition, architecture scenarios use a known species tree, with architectures evolving from a parent species to a child species; thus, no reconcilation is required, and speciation events are not modeled. In this example, the joint histories of the red and teal modules are determined, including their recent merge in the branch leading to species A, corresponding to the formation of chimeric gene a2. (D) We allow for five types of evolutionary events, two (merge and split) of which are not typically captured in conventional gene phylogenetics. (E) Gene architectures are modeled using directed graphs, with nodes representing modules and edges representing neighboring modules (within the same gene). Rearrangements of these graphs correspond to evolutionary events: Adding or removing nodes correspond to generation, duplication, or loss events (not shown), and adding or removing edges correspond to merge or split events.
F<sc>IG</sc>. 2.
FIG. 2.
Species and phylogeny of the Drosophila clade. The phylogeny of nine Drosophila species used in our analysis, as estimated by Tamura et al. (2004).
F<sc>IG</sc>. 3.
FIG. 3.
Overview of our phylogenomic pipeline. At left, the pipeline is separated into three main stages and takes as input the set of all gene sequences across several species and the known species tree relating the species. (A) In the first stage, gene sequences are compared across species, module boundaries are found, and modules are clustered according to similarity, resulting in a set of homologous module families. (B) In the second stage, a module adjacency graph is constructed based on these module families, with an edge between any two module families if at least one module instance from each family are neighbors in the same gene. Connected components of this graph define the module families to be clustered into a single architecture family. Note that (B) uses as input the module families determined by (A), but one can use domains as determined by a database search, for example, Pfam domains, if desired. (C) In the third stage, architecture scenarios are reconstructed for each architecture family based on a three-step procedure, in which the module trees are reconstructed based on multiple sequence alignments of each module family, these module trees are reconciled to determine ancestral module counts, and the module counts, extant architectures, and known species tree are used to reconstruct the ancestral architectures and ancestral events along each branch.
F<sc>IG</sc> 4.
FIG 4.
Reconstruction accuracy of STAR-MP on simulated data sets. Event inference using STAR-MP is both sensitive and precise. Error bars show performance loss due to ties in the MP reconstruction, for example, the MP architecture scenario and the true architecture scenario have equal costs, so events may be missed or extra events may be called in the MP reconstruction.
F<sc>IG</sc> 5.
FIG 5.
Correlation of module and domain boundaries. (A) For each module, either the overlap (# aa present in both module and domain/domain length) for modules incompletely covered by domains or the relative size (module length/domain length) for modules completely covered by domains was found. 75.6% of modules are equal to or larger than their corresponding domains (relative size ≥ 100%), and 28.4% of modules are of similar size to their corresponding domain (overlap ≥ 75% or relative size ≤ 150%, in gray). Bin size = 10%. (B) For each module boundary, the distance to the closest domain boundary was found, where distance = module boundary − domain boundary, blue represents left module boundaries and green represents right module boundaries. Thus, a negative distance in blue and a positive distance in green denote that the module boundary extends further than the domain boundary. Module boundaries tend to be close to domain boundaries or extend further than the closest domain boundary. Bin size = 10 aa.
F<sc>IG</sc>. 6.
FIG. 6.
Distribution of architecture family sizes. (A) The number of sequences per architecture family (20 families with more than 50 sequences not shown), and (B) the number of module families per architecture family (3 families with more than 20 modules not shown) are shown. Color denotes the number of species represented in the architecture family. Many families have simple evolutionary histories, for example, have a single gene per species or contain only two interacting modules.
F<sc>IG</sc>. 7.
FIG. 7.
Total counts of evolutionary events inferred on the nine Drosophila phylogeny by STAR-MP. Many evolutionary events are inferred along each branch (counts aggregated across 3,882 architecture scenarios). The large number of losses is consistent with ancient duplications followed by many compensatory losses. Many merges and splits are located along leaf branches, indicating that many fusion and fission genes may be lineage specific. Histograms of event counts are shown along each branch, and the number of modules in a species is displayed at each species node, where counts are totaled across all architecture scenarios.
F<sc>IG</sc>. 8.
FIG. 8.
Mechanisms for generating fused and fragmented architectures. (A) Two adjacent genes merge into a single gene, or a single gene splits into two genes. (B) A retrotransposed copy of a gene combines with exons from another gene. (C) A chromosomal segment duplicates, and alternative portions of the duplicates are lost.
F<sc>IG</sc>. 9.
FIG. 9.
The inferred evolutionary history of GH22519 in D. grimshawi through duplication–degeneration of rhea. (A) The MP architecture scenario. (The full MP architecture scenario is available for download.) Most species have the module 09411 and 04568 fused in a single gene rhea. However, dgri has the two modules in separate genes, with the rhea ortholog containing module 09411 and the GH22519 gene containing module 04568. The MP reconstruction infers a split along the branch leading to dgri. Note that in the full MP architecture scenario, there is a second gene with module 09411 in the (dmel,(dyak,dere)) ancestor, which is caused by the module tree (incorrectly) grouping dmel and dere together. This results in likely spurious duplication, loss, and split events being inferred within the melanogaster subgroup. (B) A genome level view shows that rhea and GH22519 in dgri are found on two scaffolds that alternately contain orthologs to the other eight genomes. (C) The inferred evolutionary history of rhea and GH22519 in dgri through segmental duplication followed by differential degeneration. Instead of losing the entire rhea gene in one of the duplicates, rhea undergoes alternative module loss, with each copy retaining one module of the original rhea gene. This results in two genes that appear fused in the other species and fragmented in dgri.

Similar articles

Cited by

References

    1. Akiva P, Toporik A, Edelheit S, Peretz Y, Diber A, Shemesh R, Novik A, Sorek R. Transcription-mediated gene fusion in the human genome. Genome Res. 2006;16:30–36. - PMC - PubMed
    1. Altschul SF, Madden TL, Schaffer AA, Zhang J, Zhang Z, Miller W, Lipman DJ. Gapped BLAST and PSI-BLAST: a new generation of protein database search programs. Nucleic Acids Res. 1997;25:3389–3402. - PMC - PubMed
    1. Apic G, Gough J, Teichmann SA. An insight into domain combinations. Bioinformatics. 2001;17:S83–S89. - PubMed
    1. Apic G, Huber W, Teichmann SA. Multi-domain protein families and domain pairs: comparison with known structures and a random model of domain recombination. J Struct Funct Genomics. 2003;4:67–78. - PubMed
    1. Arvestad L, Lagergren J, Sennblad B. The gene evolution model and computing its associated probabilities. JACM. 2009;56:1–44.

Publication types

LinkOut - more resources