. 2011 Aug;7(8):e1002194.
doi: 10.1371/journal.ppat.1002194. Epub 2011 Aug 25.

Transportin 3 promotes a nuclear maturation step required for efficient HIV-1 integration

Affiliations

Transportin 3 promotes a nuclear maturation step required for efficient HIV-1 integration

Lihong Zhou et al. PLoS Pathog. 2011 Aug.

Abstract

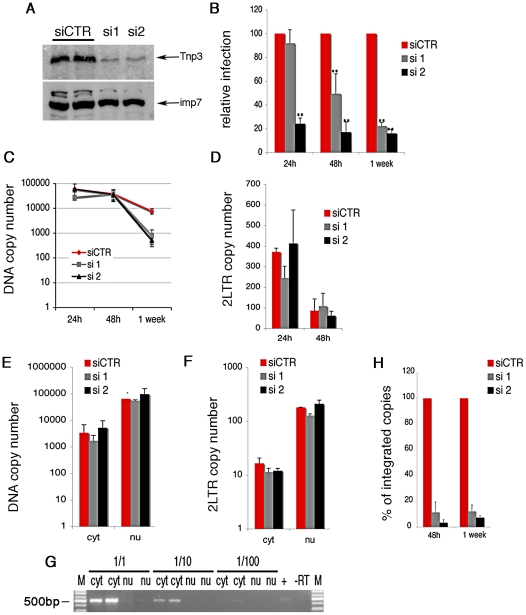
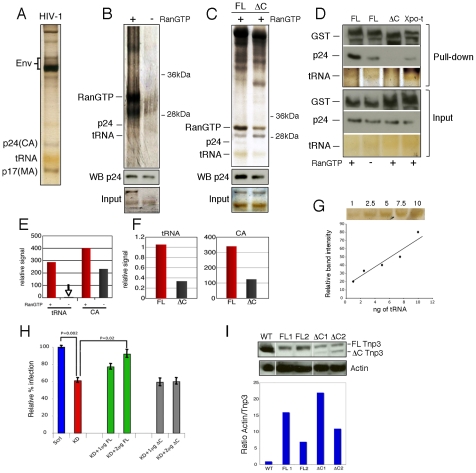
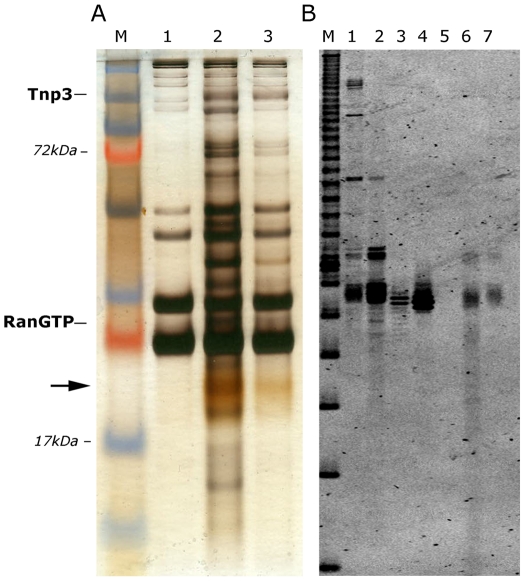
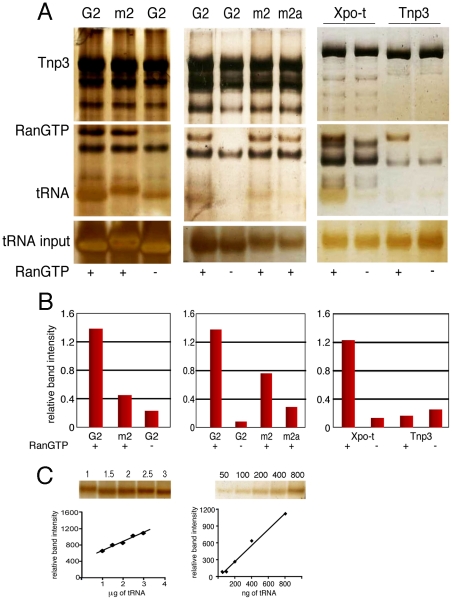
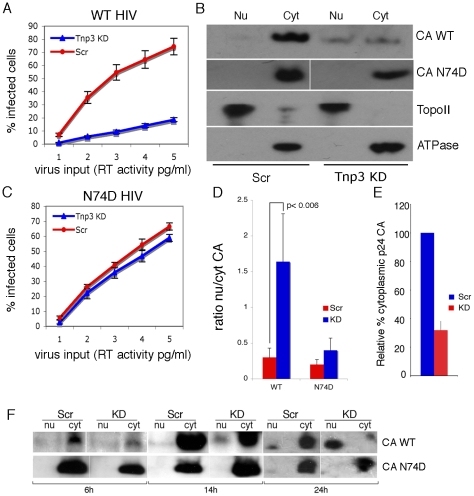
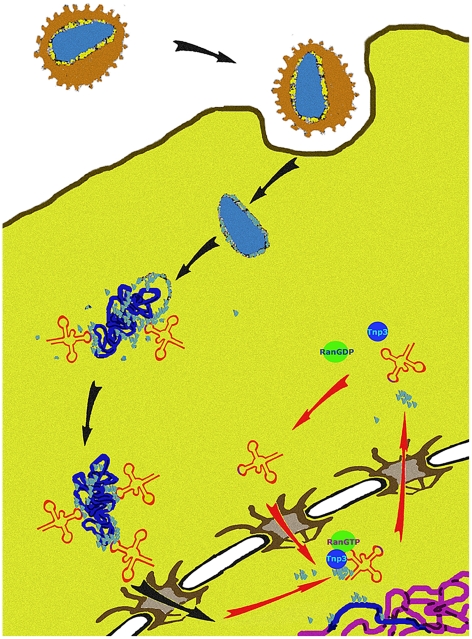
The HIV/AIDS pandemic is a major global health threat and understanding the detailed molecular mechanisms of HIV replication is critical for the development of novel therapeutics. To replicate, HIV-1 must access the nucleus of infected cells and integrate into host chromosomes, however little is known about the events occurring post-nuclear entry but before integration. Here we show that the karyopherin Transportin 3 (Tnp3) promotes HIV-1 integration in different cell types. Furthermore Tnp3 binds the viral capsid proteins and tRNAs incorporated into viral particles. Interaction between Tnp3, capsid and tRNAs is stronger in the presence of RanGTP, consistent with the possibility that Tnp3 is an export factor for these substrates. In agreement with this interpretation, we found that Tnp3 exports from the nuclei viral tRNAs in a RanGTP-dependent way. Tnp3 also binds and exports from the nuclei some species of cellular tRNAs with a defective 3'CCA end. Depletion of Tnp3 results in a re-distribution of HIV-1 capsid proteins between nucleus and cytoplasm however HIV-1 bearing the N74D mutation in capsid, which is insensitive to Tnp3 depletion, does not show nucleocytoplasmic redistribution of capsid proteins. We propose that Tnp3 promotes HIV-1 infection by displacing any capsid and tRNA that remain bound to the pre-integration complex after nuclear entry to facilitate integration. The results also provide evidence for a novel tRNA nucleocytoplasmic trafficking pathway in human cells.


Conflict of interest statement

The authors have declared that no competing interests exist.

Figures

Figure 1
Figure 1. Tnp3 supports HIV-1 infection in human macrophages.
(A) HuES-2 derived macrophages were transduced with two different doses of a lentivirus vector delivering an shRNA against human Tnp3 mRNA, or a control shRNA against dsRed mRNA and infected with a fixed amount of HIVGFP vector 96 hours later. Five days after infection with the HIVGFP vector cells were visualized by confocal microscopy. (B) ImageJ software was used to calculate the fluorescence intensity per cell relative to un-infected cells (zero value). At least 100 cells per field were counted. Average ± SD of triplicate experiments are shown. (C) Knockdown of Tnp3 was demonstrated by Western blotting (upper panel). The degree of Tnp3 knockdown was calculated by determining intensities of Tnp3 bands relative to actin bands using ImageJ software (lower panel). (D) A fixed amount of HIVGFP vector was used to infect blood-derived macrophages previously transduced with the shRNA lentiviral vector as described in (A). GFP-positive cells were visualised using confocal microscopy and infectious units calculated by counting the number of GFP+ cells per well. Average values ± SD of triplicate experiments are shown. (E) Knockdown of Tnp3 was demonstrated in blood-derived macrophages by Western blotting (upper panel). The degree of Tnp3 knockdown was calculated by determining intensities of Western blot bands using ImageJ software (lower panel).
Figure 2
Figure 2. Tnp3 is required for efficient HIV-1 infection in HeLa cells.
(A) Cells were transfected with a scramble siRNA or two different siRNAs targeting Tnp3 mRNA and analyzed by Western blot 72 h later; importin 7 (imp7) is used as a loading control. (B) Cells were transduced with HIV-1GFP vector 48h after siRNA transfection and the number of infected cells measured by flow cytometry at the indicated time points post-infection. Average values ± SD of three independent experiments are shown (** p<0.01 Student's t-test). (C) Reverse transcription and (D) accumulation of 2LTRs circular DNA forms in Tnp3 KD cells were measured by Taqman qPCR. (E-F) Infected cells were fractionated into a cytoplasmic (cyt) and nuclear (nu) fraction 24 h post-infection. Total viral DNA (E) and 2LTRs viral DNA forms (F) were quantified by TaqMan qPCR in each fraction. (G) RNA was extracted from equal volumes of each fraction and reverse transcribed into cDNA. The spliced cyclophilin A mRNA was detected by PCR (500 bp) to control for cross contamination of the fractions. M, DNA molecular weight markers. (H) DNA extracted from infected cells was subjected to Alu-LTR TaqMan qPCR to detect integrated HIV-1 copies. Signal from the 24 h time point could not be detected consistently. Average values ± mean variation from two independent experiments analyzed in triplicate are shown.
Figure 3
Figure 3. Tnp3 binds viral tRNA and CA.
(A) Purified HIV-1 vector used for pull down assays was visualized by silver staining after 15% denaturing PAGE. Env, viral envelope glycoproteins; p24(CA), capsid proteins; p17(MA), matrix proteins. (B) Pull down assay with purified virus and GST-Tnp3 in the presence or absence of RanQ69L-GTP. (C) Pull down assay with purified virus and GST-Tnp3 (FL) or GST-Tnp3 DC825 (ΔC) deletion mutant in the presence of RanQ69L-GTP. Unlabelled bands are impurities from the Tnp3 preparations. WB p24, Western blot with an anti-capsid antibody. (D) Pull down assay with GST-Tnp3 (FL), GST-Tnp3 DC825 (ΔC) or GST-Xpo-t (Xpo-t). Samples were analyzed by silver stain and by Western blot with anti-capsid and anti-GST antibodies. (E) ImageJ quantification of tRNA and CA in pull down assays as shown in B. RanGTP increased CA binding to Tnp3 by 2.5±0.5 fold in three independent experiments. (F) ImageJ quantification of pull down assays as shown in C. Values are expressed as ratio of input versus recovered tRNAs. DC825 Tnp3 had 3±0.5 fold reduced binding to CA in two independent experiments. (G) tRNA titration curve after silver staining of the SDS-PAGE gel. (H) Rescue experiment. Polyclonal populations of scramble (Scrl) or Tnp3 KD (KD) 293T cells were transfected with plasmid DNA expressing full length (FL) Tnp3 or Tnp3 DC825 bearing a silent point mutation to make them resistant to the shRNA effect (ΔC). Cells were transduced with an HIV-1GFP vector and analyzed by flow cytometry 24 hours later. Mean values ± SD of four independent experiments are shown; Student's t-test was used to calculate statistical significance. (I) Western blot to detect Tnp3 expression in transfected cells. WT, Scrl cells; FL1 and FL2, KD cells transfected with 1 µg and 2 µg Tnp3 cDNA respectively; ΔC1 and ΔC2, KD cells transfected with the same amounts of Tnp3 DC825 cDNA. Bottom panel, quantification of the Tnp3 signal. To quantify signal in FL samples, the background from pre-existing Tnp3 (as detected in the DC825 cDNA-transfected samples) was subtracted and all values were normalized for actin input.
Figure 4
Figure 4. Tnp3 binds cellular tRNAs.
(A) Pull down assays with high-speed cytosolic extracts (HSE) and GST-Tnp3 in the presence or absence of RanQ69L-GTP. Proteins bound to the beads were eluted and analyzed by 15% denaturing SDS-PAGE and silver staining. M, molecular weight protein markers; lane 1, beads only + HSE; lane 2, Tnp3 + HSE + RanQ69L-GTP; lane 3, Tnp3 + HSE without RanQ69L-GTP. The arrow points to the ∼20 kDa tRNA band. (B) Nucleic acids were purified from the same fractions, analyzed by 15% denaturing PAGE and visualized following staining with SYBRgold. Lane M, 10 bp ladder; Lane 1, total RNA from 293T cells; Lane 2, small RNA fraction from 293T cells; Lane 3, in vitro synthesized control tRNA; Lane 4, same tRNA x3; Lane 5, HSE; Lane 6, Tnp3 + HSE + RanQ69LGTP; Lane 7, Tnp3 + HSE without RanQ69LGTP.
Figure 5
Figure 5. Binding of tRNAs to Tnp3 is influenced by the 3′ CCA end.
(A) Left panel, pull-down assays with GST-Tnp3 and G2 tRNA specie or mutant G2 (m2) visualized by silver staining. Middle panel, pull down assays were performed with the m2 tRNA mutant or another G2 variant with a complete 3′ CCA end (m2a) (Table 1). Right panel, pull down assays with GST-Xpo-t or GST-Tnp3 and the m2a tRNA variant in the presence or absence of RanGTP. The (-) symbol at the bottom of the panels indicates that RanGDP was added in place of RanGTP. (B) ImageJ quantification of pull down assays shown in A. Values are expressed as ratio of recovered versus input tRNAs. (C) tRNA titration curves following SDS-PAGE and silver staining.
Figure 6
Figure 6. tRNA structural requirements for binding to Tnp3.
(A) schematic representation of the tRNA secondary structure (cloverleaf) with the mutations generated. Nucleotide changes were introduced by site-directed mutagenesis into the G2 tRNA backbone. Mutation affecting the overall tRNA 3D structure is shown in red; a revertant of this mutation is shown in blue; anticodon swaps are indicated in grey, 3′ end additions are shown in purple. (B) Pull down assays were performed in the presence or absence of Tnp3 and RanQ69L-GTP, as indicated. Eluted tRNAs and proteins were analyzed by SDS-PAGE and silver staining and quantified by ImageJ software. Values are expressed as ratio of recovered versus input tRNAs. G2 tRNA was given an arbitrary value of 1. Values above 1 indicate the fold increase in binding and values below 1 indicate the fold decrease in binding. Mean values ± SD of three independent experiments are shown. (C) Same as panel (B) but the pull down assays were performed in the presence of Xpo-t.
Figure 7
Figure 7. Tnp3 domains required for tRNA binding.
(A) Schematic representation of the Tnp3 mutant constructs. (B) Pull down assays in the presence of the indicated Tnp3 mutants, RanQ69L-GTP and G2 tRNA. Eluted proteins and tRNAs were analyzed by 15% SDS-PAGE and silver staining. Smaller bands <100 kDa are degradation impurities of Tnp3. Molecular weights (kDa) are shown on the left. ImageJ quantification of tRNA band intensity is shown below each panel. (C) tRNA titration curves following SDS-PAGE and silver staining.
Figure 8
Figure 8. Tnp3 is an export receptor for certain tRNA species.
(A) Schematic representation of the nuclear export assay. Following cell permeabilization, a nuclear import step is performed with fluorescently labeled tRNAs and the energy regenerating system. Once tRNAs accumulated into the nucleus, cells are washed and a second incubation is performed in the presence of Tnp3, the Ran system and the energy system. Samples are washed and analysed by confocal microscopy. Loss of fluorescence relative to control without Tnp3 indicated tRNA export. (B) Nuclear export of fluorescently–labelled G2 tRNAs (∼100 ng each assay) in permeabilized HeLa cells in the presence of an energy-regenerating system (E), the Ran system (R) and 1 µM of the indicated recombinant proteins. (C) Quantification of tRNA nuclear export. Images acquired by confocal microscopy were analyzed by MetaMorph software version 4.5r4 and the total nuclear fluorescence divided by the number of cells per field. Bars represent the mean fluorescence per nucleus ± average deviation of two independent experiments. At least 100 cells were counted per experiment.
Figure 9
Figure 9. Tnp3 is an export factor for tRNAs incorporated into HIV-1 particles.
(A) Viral tRNAs were isolated from purified HIV-1 particles (as shown in Figure 3A), fluorescently labeled and used (∼100 ng each assay) in the nuclear export assay as described in Figure 8 in the presence of an energy-regenerating system (E), the Ran system (R) and 1 µM Tnp3. (B) Images acquired by confocal microscopy were analyzed by MetaMorph software version 4.5r4 and the total nuclear fluorescence divided by the number of cells per field. Bars represent the mean fluorescence per nucleus ± average deviation of two independent experiments. At least 100 cells were counted per experiment.
Figure 10
Figure 10. CA is an important determinant for HIV-1 dependence on Tnp3.
Infection assays were performed in stable HeLa Tnp3 KD cells or control cells expressing a scrambled shRNA using HIV-1GFP vectors bearing the indicated mutation in CA. Viral stocks were normalized for RT activity and different volumes used for titrations. Infected cells were analysed by flow cytometry 48 hours post-infection. Note that the T54A and T54A/N57A have ∼20 fold lower infectivity than wild type virus. Data are representative of at least 3 independent experiments.
Figure 11
Figure 11. Tnp3 affects the nucleo-cytoplasmic distribution of CA.
(A) Control (Scr) and Tnp3 KD HeLa cells were infected with WT HIV-1GFP vector and analyzed by flow cytometry 24 hours later; mean values ± SD of three independent experiments are shown. (B) Infected cells were fractionated into nuclear and cytoplasmic fractions 16 hours post-infection and each fraction was analyzed by Western blot. N+/K+ ATPase (ATPase) and DNA topoisomerase II (TopoII) were used to control the fractionation procedure. Data are representative of three independent experiments. (C) Control (Scr) and Tnp3 KD HeLa cells were infected with the N74D mutant vector and analyzed by flow cytometry 24 hours later; mean values ± SD of three independent experiments are shown. (D) Relative amount of CA detected by Western blot in nuclear and cytoplasmic fractions was quantified by ImageJ; mean values ± SD of three independent experiments are shown. (E) Relative amount of CA detected by Western blot in the cytoplasmic fractions of Scr and Tnp3 KD cells was quantified by ImageJ; mean values ± SD of three independent experiments are shown. (F) Time course of CA nuclear accumulation. Cells were transduced with the HIV-1GFP vector at an MOI of 0.5 and fractionated at the indicated time points. Fractions were analysed by Western blotting with anti-CA antibodies. Virus input was normalized for infectivity in HeLa cells, hence the higher amount of N74D CA detected at the 6h time point. Similar results were obtained in another independent experiment.
Figure 12
Figure 12. A model of the role of Tnp3 in HIV-1 infection.
After virus entry into the cell, the viral core is disassembled but some capsid proteins (light blue dots) remain associated with the RTC. A complex is formed between capsid proteins, tRNAs and presumably one or more host cell factors to engage with the tRNA retrograde transport pathway, leading to nuclear import of the RTC/PIC. CA associated to the RTC/PIC may also play a role in nuclear import by binding to components of the NPC, as well as other factors that may associate with IN. Once inside the nucleus, the PIC must complete the uncoating process by removing any remaining capsid proteins and tRNAs, which are detrimental to integration. Tnp3, in complex with RanGTP, carries out this step.

Similar articles

Cited by

References

    1. Greber UF, Fassati A. Nuclear import of viral DNA genomes. Traffic. 2003;4:136–143. - PubMed
    1. Fassati A, Goff SP. Characterization of intracellular reverse transcription complexes of human immunodeficiency virus type 1. J Virol. 2001;75:3626–3635. - PMC - PubMed
    1. McDonald D, Vodicka MA, Lucero G, Svitkina TM, Borisy GG, et al. Visualization of the intracellular behavior of HIV in living cells. J Cell Biol. 2002;159:441–452. - PMC - PubMed
    1. Pornillos O, Ganser-Pornillos BK, Kelly BN, Hua Y, Whitby FG, et al. X-ray structures of the hexameric building block of the HIV capsid. Cell. 2009;137:1282–1292. - PMC - PubMed
    1. Forshey BM, von Schwedler U, Sundquist WI, Aiken C. Formation of a human immunodeficiency virus type 1 core of optimal stability is crucial for viral replication. J Virol. 2002;76:5667–5677. - PMC - PubMed

Publication types

LinkOut - more resources