. 2011 May;2(5):563-75.
doi: 10.1177/1947601911419362.

Lysophosphatidic Acid Stimulates the Proliferation of Ovarian Cancer Cells via the gep Proto-Oncogene Gα(12)

Affiliations

Lysophosphatidic Acid Stimulates the Proliferation of Ovarian Cancer Cells via the gep Proto-Oncogene Gα(12)

Zachariah G Goldsmith et al. Genes Cancer. 2011 May.

Abstract

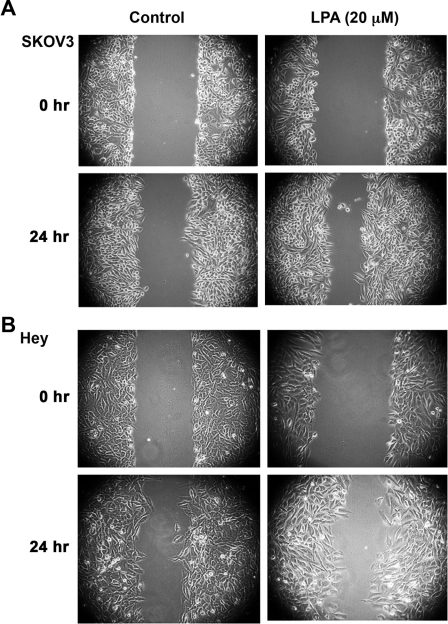
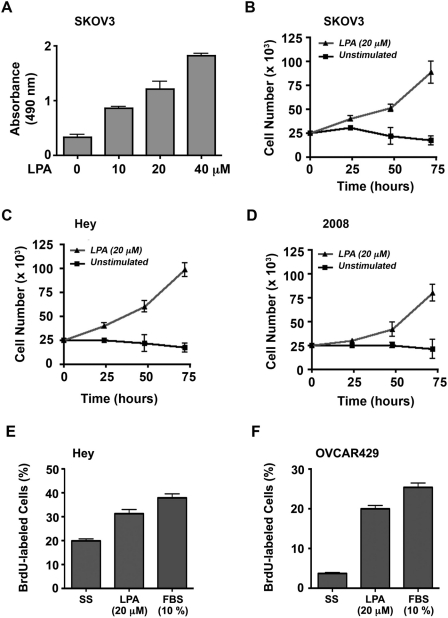
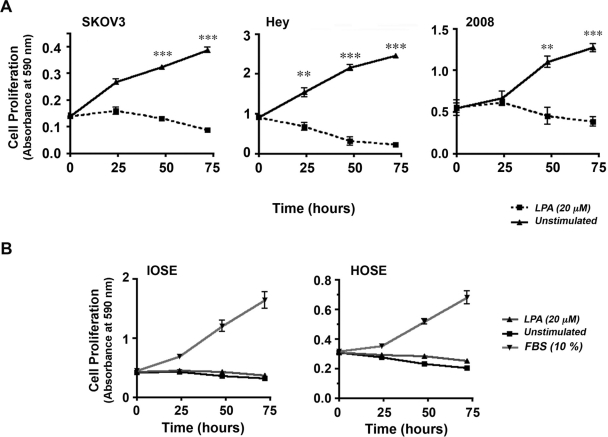
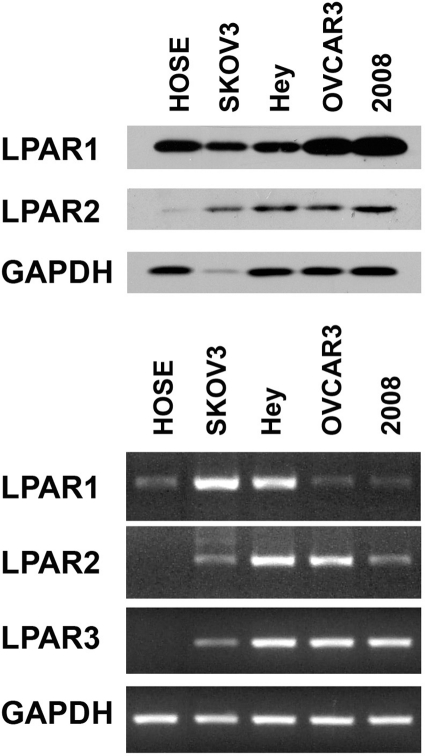
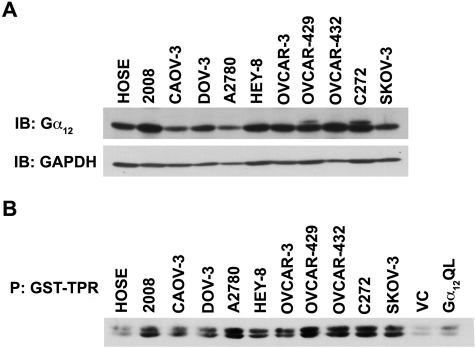
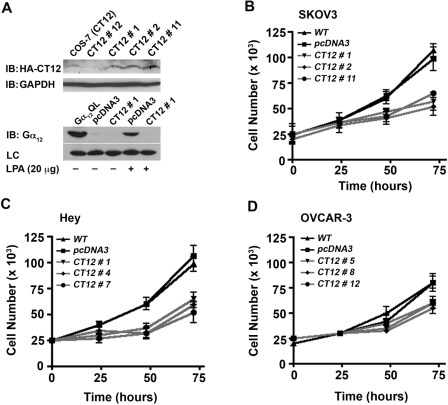
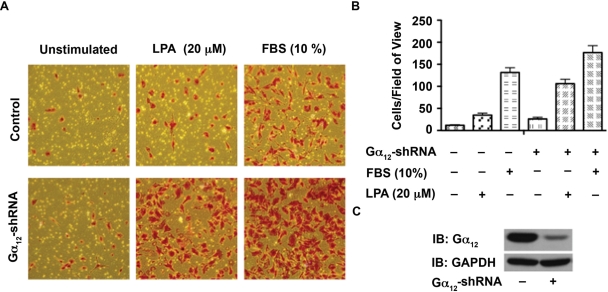
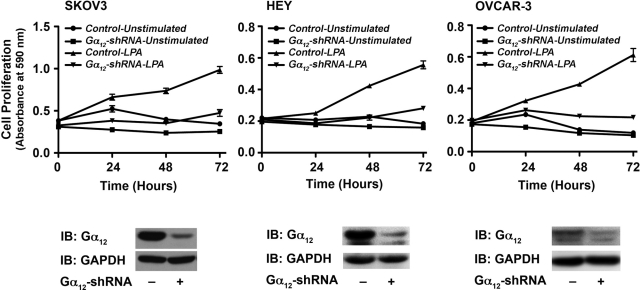
Lysophosphatidic acid (LPA), an agonist that activates specific G protein-coupled receptors, is present at an elevated concentration in the serum and ascitic fluid of ovarian cancer patients. Although the increased levels of LPA have been linked to the genesis and progression of different cancers including ovarian carcinomas, the specific signaling conduit utilized by LPA in promoting different aspects of oncogenic growth has not been identified. Here, we show that LPA stimulates both migration and proliferation of ovarian cancer cells. Using multiple approaches, we demonstrate that the stimulation of ovarian cancer cells with LPA results in a robust and statistically significant proliferative response. Our results also indicate that Gα(12), the gep proto-oncogene, which can be stimulated by LPA via specific LPA receptors, is overtly activated in a large array of ovarian cancer cells. We further establish that LPA stimulates the rapid activation of Gα(12) in SKOV-3 cells and the expression of CT12, an inhibitory minigene of Gα(12) that disrupts LPAR-Gα(12) interaction and potently inhibits such activation. Using this inhibitory molecule as well as the shRNA approach, we show that the inhibition of Gα(12) or silencing of its expression drastically and significantly attenuates LPA-mediated proliferation of ovarian cancer cell lines such as SKOV3, Hey, and OVCAR-3. Together with our findings that the silencing of Gα(12) does not have any significant effect on LPA-mediated migratory response of SKOV3 cells, our results point to a critical role for LPA-LPAR-Gα(12) signaling in ovarian cancer cell proliferation and not in migration. Thus, results presented here for the first time demonstrate that the gep proto-oncogene forms a specific node in LPA-LPAR-mediated mitogenic signaling in ovarian cancer cells.

Keywords: LPA; gep; metastasis; oncogene; proliferation.


Conflict of interest statement

The author(s) declared no potential conflicts of interest with respect to the research, authorship, and/or publication of this article.

Figures

Figure 1.
Figure 1.
LPA induces migration of ovarian cancer cells. (A) 5 × 10⁵ SKOV3 cells were plated in 60-mm plates and allowed to adhere overnight. Following serum deprivation for 24 hours, a scratch wound was made across the cell monolayer. Fields of view (100x magnification) were selected at random, photographed, and marked for re-identification. The identical fields of view were re-imaged following 24 hours of incubation with 20 µM LPA in serum-free media or serum-free media alone. These images are representative of 3 independent experiments, each performed with triplicate fields of view. (B) 5 × 10⁵ Hey cells were plated in 60-mm plates and allowed to adhere overnight. Following serum deprivation for 24 hours, a scratch wound was made across the cell monolayer. Fields of view (100x magnification) were selected at random, photographed, and marked for re-identification. The identical fields of view were re-imaged following 24 hours of incubation with 20 µM LPA in serum-free media or serum-free media alone. These images are representative of 3 independent experiments, each performed with triplicate fields of view.
Figure 2.
Figure 2.
LPA induces cell proliferation. (A) 2.5 × 10⁴ SKOV3 cells were seeded in triplicate into 96-well culture dishes, allowed to adhere overnight, and serum deprived for 24 hours. Cells were then incubated with serum-free media (unstimulated control) and media supplemented with 10, 20, or 40 µM LPA. After 48 hours, triplicate samples were processed using the CyQUANT kit as described in Materials and Methods. The absorbance is plotted for each condition as mean ± SEM (n = 3). Proliferation of SKOV3 (B), Hey (C), and 2008 (D) cells to LPA for a period of 72 hours was monitored as follows. 2.5 × 10⁴ cells in triplicate were seeded in 12-well culture dishes and allowed to adhere overnight and serum deprived for 24 hours. Cells were then incubated with 20 µM LPA in serum-free media or serum-free media alone (unstimulated control). Triplicate samples were enumerated at 0, 24, 48, and 72 hours with a hemocytometer. Cell number is plotted as mean ± SEM (n = 3). LPA-stimulated DNA syntheses in Hey (E) and OVCAR-429 (F) cells were determined by fluorescence-based BrdU incorporation assay. Ovarian cancer cells grown on 12-mm cover slips were stimulated with LPA (20 µM), FBS (10%), or none for 48 hours. Following BrdU pulsing for 24 hours, cells were fixed and immunofluorescence stained for BrdU and DAPI. BrdU-labeled cells in relation to total cells were quantified by image analysis software. Results are expressed as a percentage of BrdU cells labeled (mean ± SEM, n = 5).
Figure 3.
Figure 3.
LPA-mediated proliferation is specific to ovarian cancer cells. Proliferation of SKOV3, Hey, and 2008 cells was monitored using crystal violet–based proliferation assay (A). SKOV3, Hey, or 2008 cells plated in 12-well culture dishes (2.5 × 10⁴/well) were serum deprived for 24 hours and stimulated with 20 µM LPA along with unstimulated control groups. Triplicate samples of LPA-stimulated and -unstimulated cells were fixed at 0, 24, 48, and 72 hours using 10% formalin and stained with crystal violet. The dye taken up by the live cells were extracted into 1 mL of acetic acid and quantified by spectrophotometry at 590 nm. The absorbance at 590 nm was determined as an index of cell proliferation and plotted as mean ± SEM (n = 3). Similar analysis was carried out using HOSE and IOSE cells (B). 2.5 × 10⁴ HOSE and IOSE cells were seeded in triplicate, allowed to adhere overnight, and serum deprived for 24 hours. Cells were then incubated with serum-free media (unstimulated control), media supplemented with 20 µM LPA, or 10% FBS (positive control). Triplicate samples obtained at 0, 24, 48, and 72 hours were processed as described above, and the index of cell proliferation determined by the absorbance at 590 nm is plotted as mean ± SEM (n = 3).
Figure 4.
Figure 4.
Expression of LPARs. Expression of LPAR1 and LPAR2 HOSE, SKOV3, Hey, OVCAR-3, and 2008 was monitored by immunoblot analysis (A). Lysates (50 µg) from SKOV3, Hey, and 2008 ovarian cancer cells were collected, separated by 10% SDS-PAGE, and subjected to immunoblot analysis using antibodies specific to LPAR1, LPAR2, or GAPDH (loading control). The experiment was repeated 5 times, and a representative immunoblot is presented. Expression of LPAR1, LPAR2, and LPAR3 was monitored by RT-PCR analysis (B). RNA from 2 nonmalignant (HOSE, IOSE) and 4 malignant ovarian cell lines was prepared, and RT-PCR analyses were carried out with primers specific to LPAR1, LPAR2, LPAR3, and GAPDH (positive control), as described in Materials and Methods. The experiment was repeated 5 times, and a representative RT-PCR analysis is presented.
Figure 5.
Figure 5.
Expression and activation profiles of Gα12 in ovarian cancer cells. Lysates (50 µg) from a panel of ovarian cancer cell lines were collected, separated by 10% SDS-PAGE, and subjected to immunoblot analysis using antibodies specific to Gα12. Each blot was stripped and reprobed with the indicated antibody and with GAPDH as a loading control. The experiment was repeated 4 times, and a representative immunoblot is presented (A). Activation profile of Gα12 in this panel of ovarian cancer cell lines was monitored by GST-TPR binding/pull-down assay (B). Lysates (500 µg) from these cells, as well as Cos-7 cells transfected with vector control (VC) and constitutively active Gα12 (Gα12QL) for positive control, were incubated with 30 µL of 50% GST-TPR beads for 4 hours. Following this pull-down, the samples were fractionated by 15% SDS-PAGE and subjected to immunoblot analysis using antibodies specific to Gα12 and a loading control. The experiment was repeated 3 times, and a representative immunoblot is presented.
Figure 6.
Figure 6.
Dominant-negative inhibitory mutant of Gα12 attenuates LPA-mediated proliferation of ovarian cancer cells. Expression of CT12, the dominant-negative inhibitory mutant of Gα12, was monitored by immunoblot analysis using 250 µg of lysates obtained from representative CT12-SKOV3 clones (A, upper panel). GST-TPR assay was used to monitor the ability of CT12 to inhibit LPA-LPAR stimulation of Gα12 (A, lower panel). Stable cell lines expressing dominant-negative Gα12 (CT12) or empty vector (pcDNA3) were stimulated with 20 µM LPA or unstimulated control for 1 minute. Lysates (500 µg) from these cells, as well as Cos-7 cells transfected with constitutively active Gα12 (Gα12QL) for positive control, were incubated with 30 µL of 50% GST-TPR beads for 4 hours. Following this pull-down, the samples were fractionated by 15% SDS-PAGE and subjected to immunoblot analysis using antibodies specific to Gα12 and an unspecified band in the pull-down assay as a loading control. The experiment was repeated 3 times, and a representative immunoblot is presented. Ability of CT12 to attenuate LPA-mediated proliferation of SKOV3 (B), Hey (C), or OVCAR-3 (D) cells was analyzed by crystal violet–based proliferation assay. SKOV3, Hey, and OVCAR-3 cells stably expressing pcDNA-CT12 were seeded (2.5 × 10⁴ cells/well), serum deprived for 24 hours, and stimulated with 20 µM LPA. Triplicate samples were collected at 0, 24, 48, and 72 hours following LPA stimulation and processed for proliferation assays as previously described. Absorbance at 590 nm was used as an index of cell proliferation. Presented results are from 3 independent analyses (mean ± SEM).
Figure 7.
Figure 7.
Silencing Gα12 does not attenuate LPA-mediated SKOV3 cell migration. (A) SKOV3 cells in which the expression of Gα12 was silenced by shRNA to Ga12 (Ga12-shRNA) were monitored for their migratory response to LPA (20 µg) along with vector as well as unstimulated control groups as described under Materials and Methods. At 20 hours following LPA stimulation, images were obtained of random fields of view at 100x magnification. The images shown are representative of 3 independent experiments, each performed with triplicate fields of view. (B) Cell migration profiles were quantified by enumerating the migrated cells in a minimum of 3 fields. Results are presented as the number of migrated cells per field, and the bars represent the mean ± SEM from 3 independent experiments. (C) Silencing of endogenous Gα12 was monitored by immunoblot analysis using antibodies to Gα12. The blot was stripped and reproved with antibodies to GAPDH to monitor equal loading of protein.
Figure 8.
Figure 8.
Silencing Gα12 attenuates LPA-mediated SKOV3 cell migration. Proliferation of SKOV3, Hey, and OVCAR-3 cells (2.5 × 10⁵ cells/well) in which the expression of endogenous Gα12 was silenced by stably expressed Gα12-specific shRNA in response to LPA (20 µg) along with unstimulated control groups using crystal violet–based proliferation assay. Triplicate samples were collected at 0, 24, 48, and 72 hours following LPA stimulation and processed for analysis. Absorbance at 590 nm was used as an index of cell proliferation. Results are mean ± SEM from 3 independent experiments (upper panel). Silencing of endogenous Gα12 by shRNA in the respective cell line was monitored by immunoblot analysis using Gα12 antibodies (lower panel). The respective blots were stripped and reprobed with GAPDH antibodies to ascertain equal protein loading.

Similar articles

Cited by

References

    1. Jemal A, Siegel R, Xu J, Ward E. Cancer statistics, 2010. CA Cancer J Clin. 2010;60:277-300 - PubMed
    1. Mills GB, May C, McGill M, Roifman CM, Mellors A. A putative new growth factor in ascitic fluid from ovarian cancer patients: identification, characterization, and mechanism of action. Cancer Res. 1998;48:1066-71 - PubMed
    1. Xu Y, Fang XJ, Casey G, Mills GB. Lysophospholipids activate ovarian and breast cancer cells. Biochem J. 1995;309:933-40 - PMC - PubMed
    1. Fishman DA, Liu Y, Ellerbroek SM, Stack MS. Lysophosphatidic acid promotes matrix metalloproteinase (MMP) activation and MMP-dependent invasion in ovarian cancer cells. Cancer Res. 2001;61:3194-9 - PubMed
    1. Sawada K, Morishige K, Tahara M, et al. Alendronate inhibits lysophosphatidic acid-induced migration of human ovarian cancer cells by attenuating the activation of rho. Cancer Res. 2002;62:6015-20 - PubMed

LinkOut - more resources