. 2011 Jul;14(4):165-78.
doi: 10.1179/147683011X13009738172396.

Prenatal protein malnutrition alters the proportion but not numbers of parvalbumin-immunoreactive interneurons in the hippocampus of the adult Sprague-Dawley rat

Affiliations

Prenatal protein malnutrition alters the proportion but not numbers of parvalbumin-immunoreactive interneurons in the hippocampus of the adult Sprague-Dawley rat

James P Lister et al. Nutr Neurosci. 2011 Jul.

Abstract

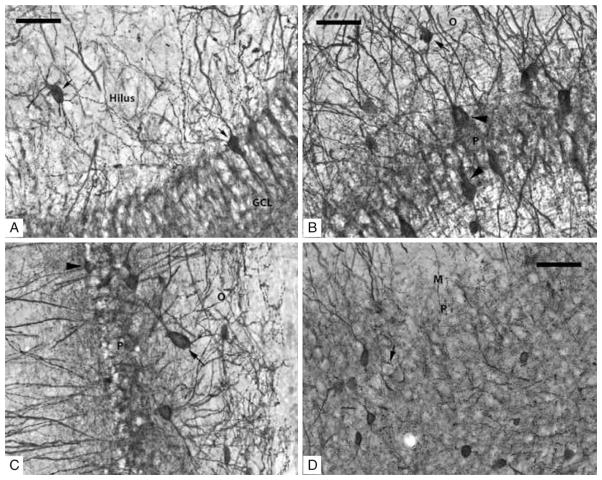
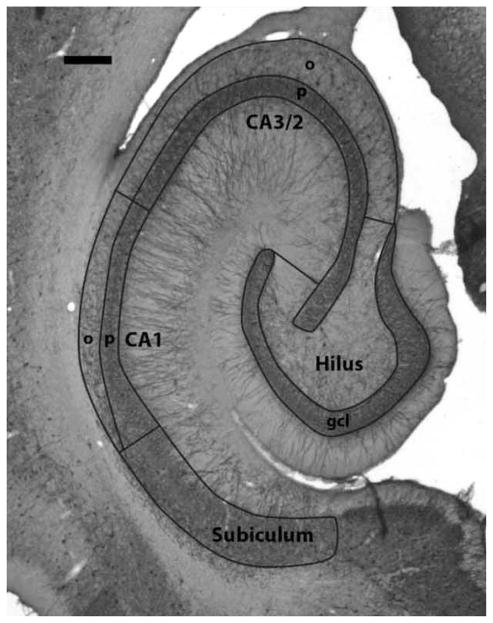
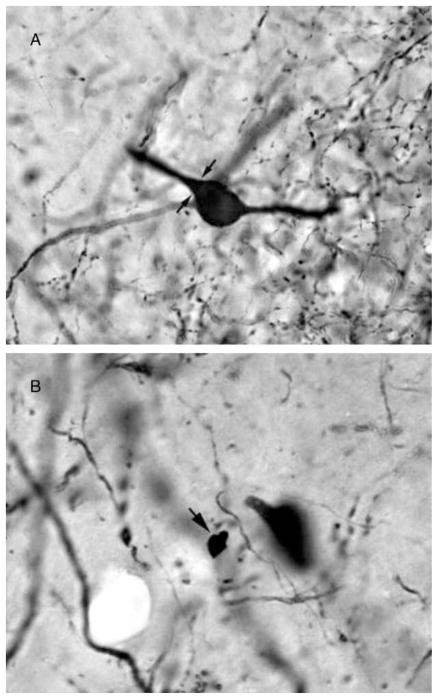
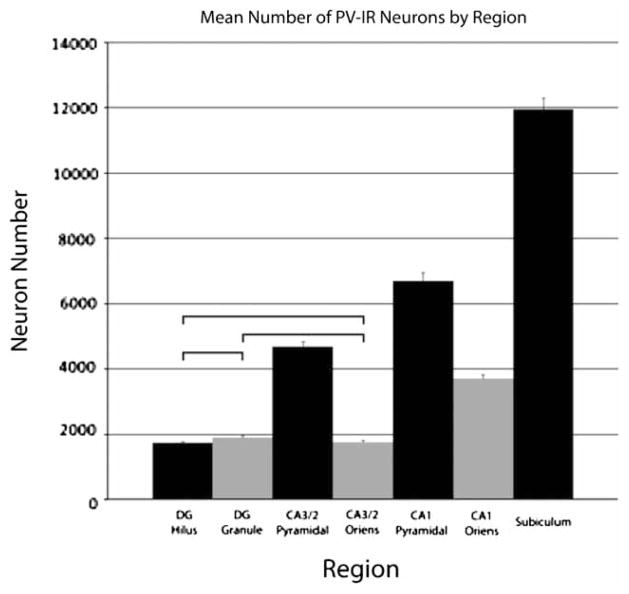
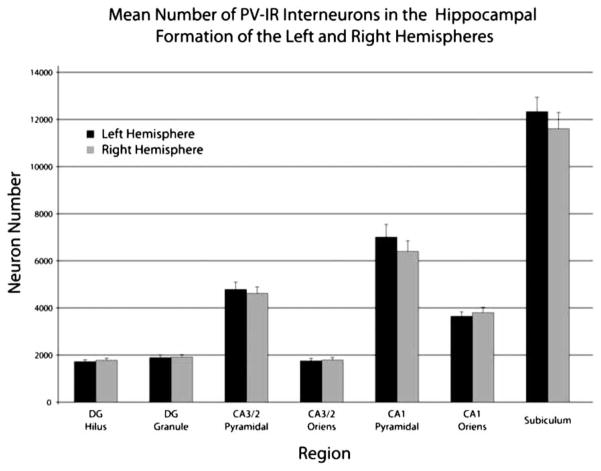
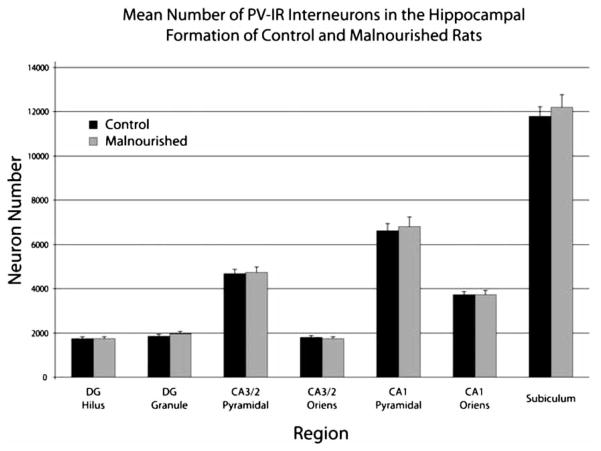
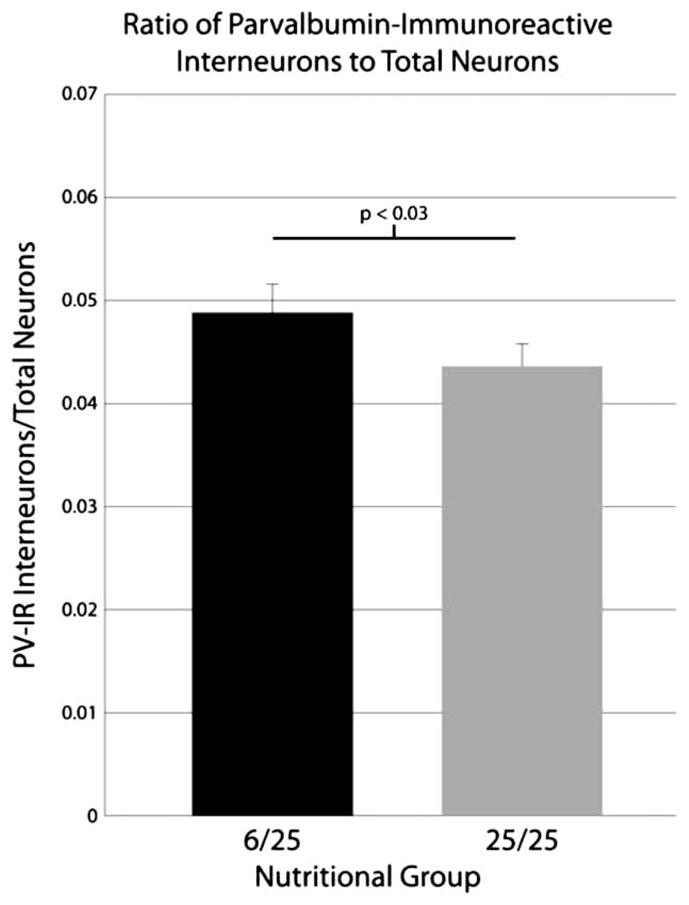
Prenatal protein malnutrition alters the structure and function of the adult rat hippocampal formation. The current study examines the effect of prenatal protein malnutrition on numbers of parvalbumin-immunoreactive (PV-IR) GABAergic interneurons, which are important for perisomatic inhibition of hippocampal pyramidal neurons. Brain sections from prenatally protein malnourished and normally nourished rats were stained for parvalbumin and PV-IR neurons were quantified using stereology in the dentate gyrus, CA3/2 and CA1 subfields, and the subiculum for both cerebral hemispheres. Results demonstrated that prenatal malnutrition did not affect the number of PV-IR interneurons in the hippocampus. Since prenatal protein malnutrition reduces total neuron numbers in the CA1 subfield (1), this results in an altered ratio of PV-IR interneurons to total neuronal numbers (from 1:22.9 in controls to 1:20.5 in malnourished rats). Additionally, there was no hemispheric asymmetry of either PV-IR neuron numbers or ratio of PV-IR:total neuron numbers.


Figures

Figure 1
Figure 1
(A–D) Photomicrographs taken with a 40× objective of PV-IR neurons in the subfields of the rat hippocampus. (A) Dentate Gyrus: short arrows indicate two PV-IR interneurons; one in the hilus and the other is inside the GCL. PV-IR fibers can be seen passing through both the hilus and the GCL where they are densely distributed in a ‘honeycombed’ fashion around granule cell somatas which are PV-IR negative. (B) CA3/2 subfield: several PV-IR interneurons are visible in both stratum pyramidale and oriens; an arrow indicates a darkly stained example in stratum oriens, and arrowheads indicate two examples of interneurons in the pyramidal layer. Unstained pyramidal neurons are responsible for the clear, ‘honeycombed’ appearance similar to the GCL. (C) CA1 subfield: a PV-IR interneuron located in the pyramidal layer is marked with an arrowhead; a PV-IR located just inside the stratum oriens is indicated by an arrow. (D) Subiculum: several PV-IR interneurons are clearly visible in the pyramidal layer. The location of an unstained pyramidal cell, surrounded by darkly stained contacts formed by the axons of PV-IR interneurons, is indicated by the arrow. Scale bars = 50 μm.
Figure 2
Figure 2
Photomicrograph of a representative section of the hippocampal formation stained with an antibody for parvalbumin. The borders of the measured regions are outlined and labeled. Abbreviations in this and subsequent figures: gcl, granule cell layer; o, stratum oriens; p, stratum pyramidale. Scale bar = 500 μm.
Figure 3
Figure 3
These photomicrographs present examples of objects that would or would not be counted. (A) A stained neuron that qualified for counting due to the continuous border of the neuronal cell body and the stained processes extending from the soma. Arrows indicate the limit between the neuronal cell body and a stained process which, by itself, would not qualify as a countable object. (B) Arrow indicates a stained object that is not countable as a neuron. Note the lack of processes and the irregular border that is not consistent with neuronal morphology.
Figure 4
Figure 4
Graph depicting the mean number of PV-IR neurons in the seven hippocampal subfields. Data are collapsed across the nutrition and hemisphere factors due to the lack of significant effects for those factors. A significant effect of the region factor was found; follow-up tests found significant differences in PV-IR neuron number in all comparisons except for the three indicated in the graph: the DG hilus, the DG granule cell layer, and the CA3/2 stratum oriens all had the same number of PV-IR neurons. Error bars are equal to the SEM.
Figure 5
Figure 5
Graph depicting the mean number of PV-IR interneurons estimated for left and right hippocampal formations by region and layer. Each bar represents the average number of PV-IR interneurons in the specified layer and includes data from both control and prenatally malnourished rats; error bars are equal to the SEM.
Figure 6
Figure 6
Graph depicting the mean number of PV-IR interneurons estimated for control and prenatally malnourished rats by region and layer. Each bar represents the average number of PV-IR interneurons in the specified layer and includes data from both hemispheres; error bars are equal to the SEM.
Figure 7
Figure 7
Graph depicting the ratios of PV-IR interneurons to total neurons in the prenatally malnourished and control rats. There is a significant increase of 11.9% in this ratio for the prenatally malnourished animals. Data are collapsed across subfields due to the lack of a significant effect for the region factor; error bars are equal to the SEM. Total neuron data used in constructing ratios are taken from a prior study as noted in the text.

References

    1. Lister JP, Tonkiss J, Blatt GJ, Kemper TL, Debassio WA, Galler JR, et al. Asymmetry of neuron numbers in the hippocampal formation of prenatally malnourished and normally nourished rats: a stereological investigation. Hippocampus. 2006;16(11):946–58. - PubMed
    1. Galler JR, Shumsky JS, Morgane PJ. Malnutrition and brain development. In: Walker W, Watkins J, editors. Nutrition in pediatrics. Neuilly-sur-Seine, France: B.C. Decker, Inc; 1996. pp. 196–212.
    1. Morgane PJ, Mokler DJ, Galler JR. Effects of prenatal protein malnutrition on the hippocampal formation. Neurosci Biobehav Rev. 2002;26(4):471–83. - PubMed
    1. Tonkiss J, Galler J, Morgane PJ, Bronzino JD, Austin-LaFrance RJ. Prenatal protein malnutrition and postnatal brain function. Ann N Y Acad Sci. 1993;678:215–27. - PubMed
    1. Austin KB, Bronzino J, Morgane PJ. Prenatal protein malnutrition affects synaptic potentiation in the dentate gyrus of rats in adulthood. Brain Res. 1986;394(2):267–73. - PubMed

Publication types

LinkOut - more resources