. 2011 Sep 8;71(5):812-9.
doi: 10.1016/j.neuron.2011.06.025.

Rapid plasticity of visual responses in the adult lateral geniculate nucleus

Affiliations

Rapid plasticity of visual responses in the adult lateral geniculate nucleus

Bartlett D Moore 4th et al. Neuron. .

Abstract

Compared to the developing visual system, where neuronal plasticity has been well characterized at multiple levels, little is known about plasticity in the adult, particularly within subcortical structures. We made intraocular injections of 2-amino-4-phosphonobutyric acid (APB) in adult cats to block visual responses in On-center retinal ganglion cells and examined the consequences on visual responses in the lateral geniculate nucleus (LGN) of the thalamus. In contrast to current views of retinogeniculate organization, which hold that On-center LGN neurons should become silent with APB, we find that ∼50% of On-center neurons rapidly develop Off-center responses. The time course of these emergent responses and the actions of APB in the retina indicate the plasticity occurs within the LGN. These results suggest there is greater divergence of retinogeniculate connections than previously recognized and that functionally silent, nonspecific retinal inputs can serve as a substrate for rapid plasticity in the adult.


Figures

Figure 1
Figure 1
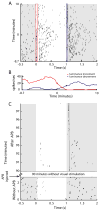
Time course of On to Off plasticity in the LGN. (A) Raster plot showing spiking activity of a representative On-center LGN neuron to a full-field visual stimulus that alternated between grey (38 candelas/m2) and white (76 candelas/m2). The vertical red and blues lines mark the windows used to quantify visual responses in panel B. (B) Quantification of responses to luminance increases and decreases. Red and blue traces show the neuron’s firing rate calculated from a sliding 20-trial window during the first 50 msec following stimulus transition. Red and blue circles indicate when On responses first decreased to 50% of maximum and Off responses first increased to 50% of maximum, respectively. Time zero in panel A (y axis) corresponds to the time when On response dropped to 50% of maximum. (C) Raster plot showing responses from an On-center LGN neuron that received no visual stimulation for 90 minutes following intraocular APB injection. Off responses are evident in the first trial following the hiatus from visual stimulation.
Figure 2
Figure 2
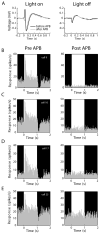
APB effects in the eye. (A) Electroretinograms (ERGs) showing responses to a repeating full-field stimulus that alternated between a 1-second bright phase and a 1-second dark phase (76 and <1 cd/m2, respectively). Black traces show values before APB, grey traces show values after APB injection. In the light-on condition, the sharp upward deflection before APB injection (black trace) represents the coordinated On-bipolar cell depolarization. This deflection was absent following APB injection (grey trace), confirming APB silenced the On-pathway. In the light-off condition, the ERG was unaffected by APB injection, supporting the view that APB does not cause an enhancement of Off responses in the retina. Axis conventions as in Slaughter and Miller (1981). (B-E) Spiking responses of 4 representative On-center RGCs before and during APB perfusion, in vitro. Recordings were made from excised patches of retina using a 60-channel multielectrode array. In each panel, the bright and dark phases of an alternating stimulus are indicated in the background shading. Each of the On cells shows a clear elevation in spiking activity in response to increases in stimulus luminance. The same cells were unresponsive to visual stimulation during 300 μM APB treatment. Every On-center RGC in our sample (n=32) became visually unresponsive with APB.
Figure 3
Figure 3
LGN RFs before and after intraocular injections of APB. (A-E) RF maps of 5 LGN neurons before and after intraocular injection of APB. RFs were mapped using a white-noise stimulus and reverse-correlation analysis. On responses shown in red, Off responses shown in blue. Scalebars indicate 1° of visual angle. Pixel brightness indicates strength of response. The strength of each post-APB RF is shown normalized to the pre-APB RF with a scaling factor indicated in the lower left of the panel. (A) A typical Off-center cell shows little difference before (left) and after (right) APB injection. (B) A typical On-center cell that became unresponsive following APB application. (C-E) Examples of On-center cells with emergent Off-center RFs following APB application. (F) Summary of the relative size and location of emergent Off-center RFs. The thick black circle corresponds to the initial RF center of 13 On-center neurons fitted with a Gaussian equation and shown with a radius of two space constants (2σ). The overlapping grey circles show the relative size and location of the emergent Off-center RFs with the centers indicated with small black circles. Emergent Off centers were 1.19 +/− 0.06 σ larger, on average, than initial the On centers. Emergent Off RFs were shifted by 0.6 +/− 0.12σ, on average, from the initial On centers.
Figure 4
Figure 4
Visual response latency and strength of responses before and after APB application. (A, B) Impulse responses from 2 On-center LGN neurons calculated before and after APB application. Impulse responses calculated from pixels in the RF maps corresponding to the RF center. Data points fitted with a cubic spline. Asterisks indicate the primary peak for each response. Both neurons show an emergent Off response after APB application. (C) Latency to peak center response before and after APB application. On cells with emergent Off responses shown in red, Off cells shown in blue. Following APB treatment, emergent Off responses were significantly faster than initial On responses; Off cell latencies were not affected by APB. (D) Center strength before and after APB application. Center strength was quantified as the integral of the primary impulse response peak. On cells with emergent Off responses shown in red, Off cells shown in blue. Both groups of LGN neurons show a significant decrease in center strength with APB.

Similar articles

Cited by

References

    1. Allen EA, Freeman RD. Dynamic spatial processing originates in early visual pathways. J Neurosci. 2006;26:11763–11774. - PMC - PubMed
    1. Berg DK, Hall ZW. Increased extrajunctional acetylcholine sensitivity produced by chronic acetylcholine sensitivity produced by chronic post-synaptic neuromuscular blockade. J Physiol. 1975;244:659–676. - PMC - PubMed
    1. Bickford ME, Wei H, Eisenback MA, Chomsung RD, Slusarczyk AS, Dankowsi AB. Synaptic organization of thalamocortical axon collaterals in the perigeniculate nucleus and dorsal lateral geniculate nucleus. J Comp Neurol. 2008;508:264–285. - PMC - PubMed
    1. Bolz J, Wässle H, Their P. Pharmacological modulation of on and off ganglion cells in the cat retina. Neuroscience. 1984;12:875–885. - PubMed
    1. Buonomano DV, Merzenich MM. Cortical plasticity: from synapses to maps. Annu Rev Neurosci. 1998;21:149–186. - PubMed

Publication types

MeSH terms

Substances

LinkOut - more resources